


Notebooks

Categories


Cells
Premium


BioTuring
Mapping out the coarse-grained connectivity structures of complex manifolds
Biological systems often change over time, as old cells die and new cells are created through differentiation from progenitor cells. This means that at any given time, not all cells will be at the same stage of development. In this sense, a single-cell sample could contain cells at different stages of differentiation. By analyzing the data, we can identify which cells are at which stages and build a model for their biological transitions.
By quantifying the connectivity of partitions (groups, clusters) of the single-cell graph, partition-based graph abstraction (PAGA) generates a much simpler abstracted graph (PAGA graph) of partitions, in which edge weights represent confidence in the presence of connections.
In this notebook, we will introduce the concept of single-cell Trajectory Analysis using PAGA (Partition-based graph abstraction) in the context of hematopoietic differentiation.
BioTuring
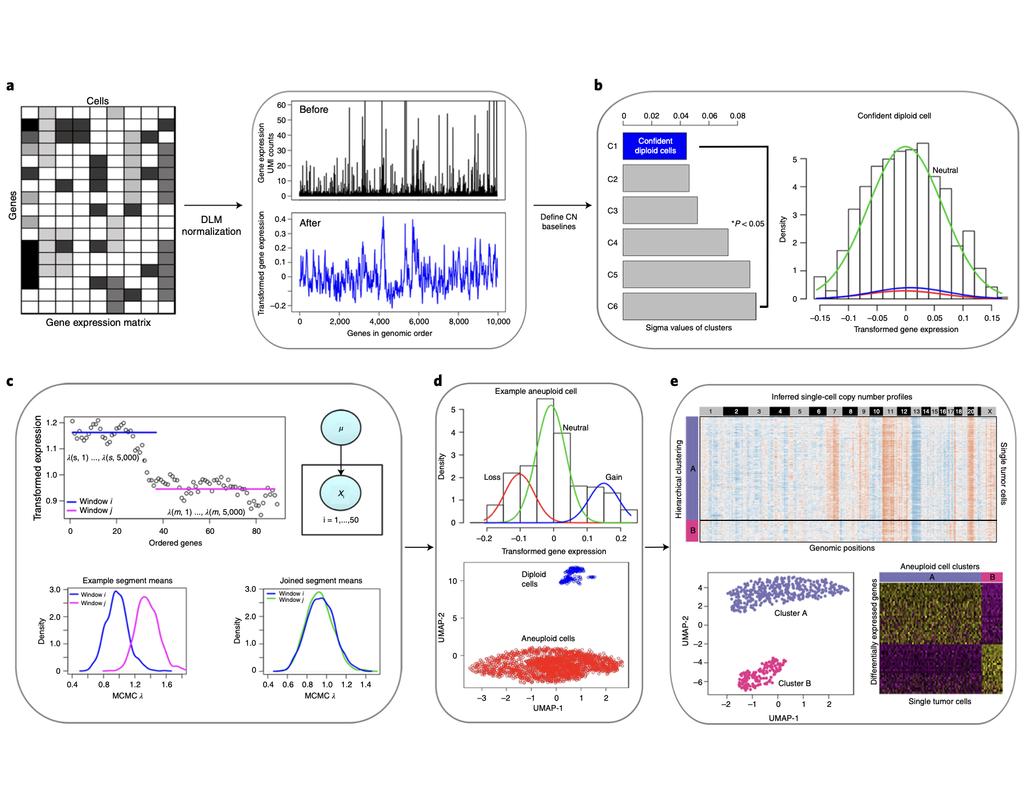
Classification of tumor and normal cells in the tumor microenvironment from scRNA-seq data is an ongoing challenge in human cancer study.
Copy number karyotyping of aneuploid tumors (***copyKAT***) (Gao, Ruli, et al., 2021) is a method proposed for identifying copy number variations in single-cell transcriptomics data. It is used to predict aneuploid tumor cells and delineate the clonal substructure of different subpopulations that coexist within the tumor mass.
In this notebook, we will illustrate a basic workflow of CopyKAT based on the tutorial provided on CopyKAT's repository. We will use a dataset of triple negative cancer tumors sequenced by 10X Chromium 3'-scRNAseq (GSM4476486) as an example. The dataset contains 20,990 features across 1,097 cells. We have modified the notebook to demonstrate how the tool works on BioTuring's platform.
BioTuring
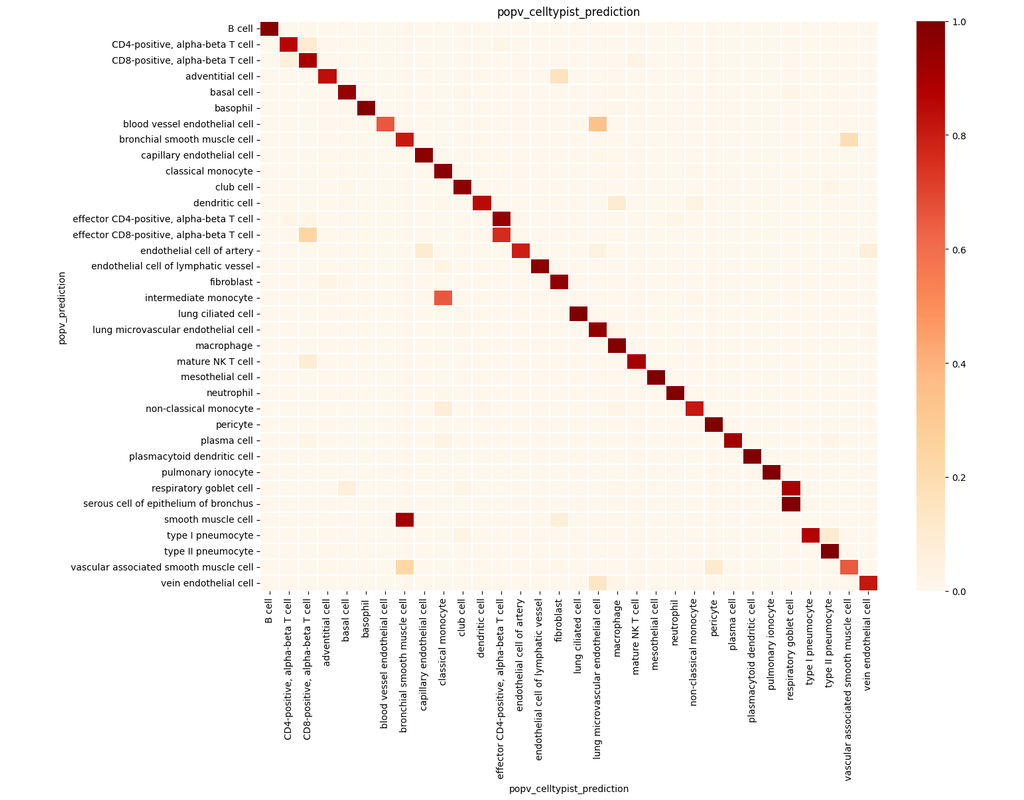
PopV uses popular vote of a variety of cell-type transfer tools to classify cell-types in a query dataset based on a test dataset.
Using this variety of algorithms, they compute the agreement between those algorithms and use this agreement to predict which cell-types have a high likelihood of the same cell-types observed in the reference.

BioTuring
Many spatially resolved transcriptomic technologies do not have single-cell resolution but measure the average gene expression for each spot from a mixture of cells of potentially heterogeneous cell types.
Here, we introduce a deconvolution method, conditional autoregressive-based deconvolution (CARD), that combines cell-type-specific expression information from single-cell RNA sequencing (scRNA-seq) with correlation in cell-type composition across tissue locations. Modeling spatial correlation allows us to borrow the cell-type composition information across locations, improving accuracy of deconvolution even with a mismatched scRNA-seq reference.
**CARD** can also impute cell-type compositions and gene expression levels at unmeasured tissue locations to enable the construction of a refined spatial tissue map with a resolution arbitrarily higher than that measured in the original study and can perform deconvolution without an scRNA-seq reference.
Applications to four datasets, including a pancreatic cancer dataset, identified multiple cell types and molecular markers with distinct spatial localization that define the progression, heterogeneity and compartmentalization of pancreatic cancer.
Trends

BioTuring
Monorail can be used to process local and/or private data, allowing results to be directly compared to any study in recount3. Taken together, Monorail-pipeline tools help biologists maximize the utility of publicly available RNA-seq data, especially (More)
| Notebooks |
|---|