


Notebooks

Categories


Cells
Premium


BioTuring
CellRank2 (Weiler et al, 2023) is a powerful framework for studying cellular fate using single-cell RNA sequencing data. It can handle millions of cells and different data types efficiently. This tool can identify cell fate and probabilities across various data sets. It also allows for analyzing transitions over time and uncovering key genes in developmental processes. Additionally, CellRank2 estimates cell-specific transcription and degradation rates, aiding in understanding differentiation trajectories and regulatory mechanisms.
In this notebook, we will use a primary tumor sample of patient T71 from the dataset GSE137804 (Dong R. et al, 2020) as an example. We have performed RNA-velocity analysis and pseudotime calculation on this dataset in scVelo (Bergen et al, 2020) notebook. The output will be then loaded into this CellRank2 notebook for further analysis.
This notebook is based on the tutorial provided on CellRank2 documentation. We have modified the notebook and changed the input data to show how the tool works on BioTuring's platform.
BioTuring
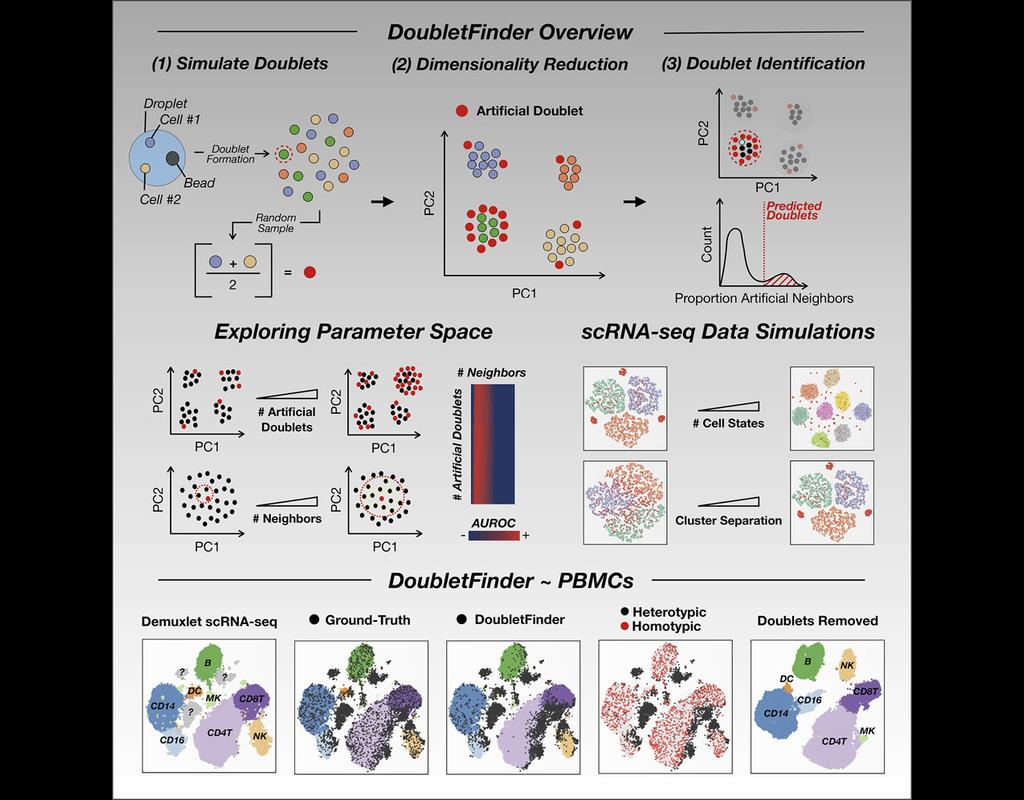
Single-cell RNA sequencing (scRNA-seq) data often encountered technical artifacts called "doublets" which are two cells that are sequenced under the same cellular barcode.
Doublets formed from different cell types or states are called heterotypic and homotypic otherwise. These factors constrain cell throughput and may result in misleading biological interpretations.
DoubletFinder (McGinnis, Murrow, and Gartner 2019) is one of the methods proposed for doublet detection. In this notebook, we will illustrate an example workflow of DoubletFinder. We use a 10x Genomics dataset which captures peripheral blood mononuclear cells (PBMCs) from a healthy donor stained with a panel of 31 TotalSeq™-B antibodies (BioLegend).
BioTuring
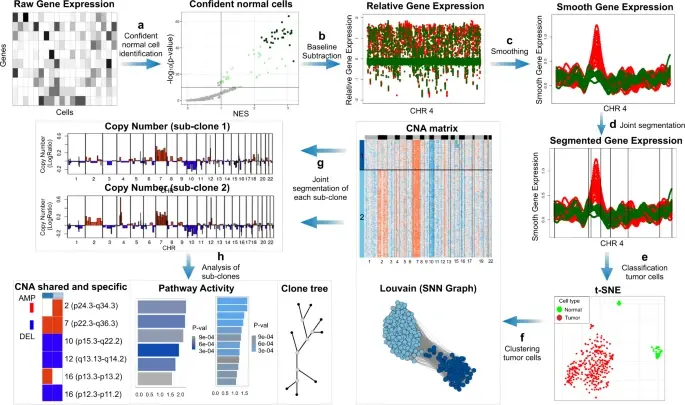
In the realm of cancer research, grasping the intricacies of intratumor heterogeneity and its interplay with the immune system is paramount for deciphering treatment resistance and tumor progression. While single-cell RNA sequencing unveils diverse transcriptional programs, the challenge persists in automatically discerning malignant cells from non-malignant ones within complex datasets featuring varying coverage depths. Thus, there arises a compelling need for an automated solution to this classification conundrum.
SCEVAN (De Falco et al., 2023), a variational algorithm, is designed to autonomously identify the clonal copy number substructure of tumors using single-cell data. It automatically separates malignant cells from non-malignant ones, and subsequently, groups of malignant cells are examined through an optimization-driven joint segmentation process.
BioTuring
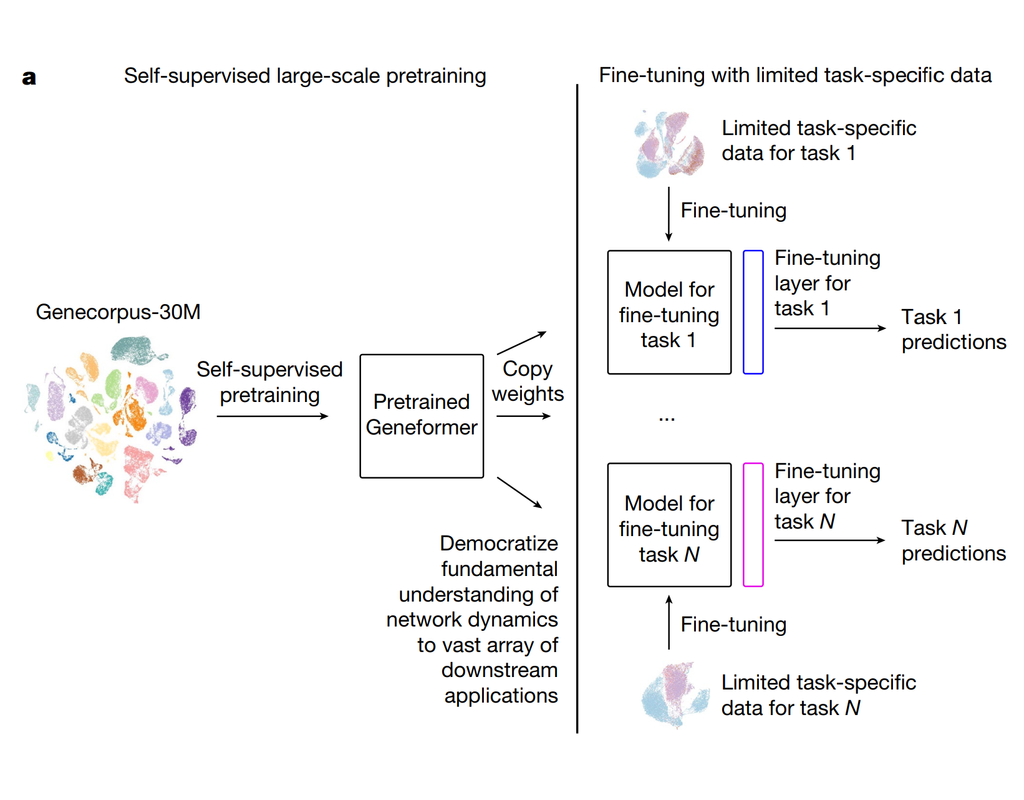
Geneformer is a foundation transformer model pretrained on a large-scale corpus of ~30 million single cell transcriptomes to enable context-aware predictions in settings with limited data in network biology. Here, we will demonstrate a basic workflow to work with ***Geneformer*** models.
These notebooks include the instruction to:
1. Prepare input datasets
2. Finetune Geneformer model to perform specific task
3. Using finetuning models for cell classification and gene classification application
Trends

BioTuring
Spatially resolved gene expression profiles are key to understand tissue organization and function. However, spatial transcriptomics (ST) profiling techniques lack single-cell resolution and require a combination with single-cell RNA sequencing (scRN(More)