


Notebooks

Categories


Cells
Premium


BioTuring
Single-cell RNA data allows cell-cell communications (***CCC***) methods to infer CCC at either the individual cell or cell cluster/cell type level, but physical distances between cells are not preserved Almet, Axel A., et al., (2021). On the other hand, spatial data provides spatial distances between cells, but single-cell or gene resolution is potentially lost. Therefore, integrating two types of data in a proper manner can complement their strengths and limitations, from that improve CCC analysis.
In this pipeline, we analyze CCC on Visium data with single-cell data as a reference. The pipeline includes 4 sub-notebooks as following
01-deconvolution: This step involves deconvolution and cell type annotation for Visium data, with cell type information obtained from a relevant single-cell dataset. The deconvolution method is SpatialDWLS which is integrated in Giotto package.
02-giotto: performs spatial based CCC and expression based CCC on Visium data using Giotto method.
03-nichenet: performs spatial based CCC and expression based CCC on Visium data using NicheNet method.
04-visualization: visualizes CCC results obtained from Giotto and NicheNet.

BioTuring
Advances in multi-omics have led to an explosion of multimodal datasets to address questions from basic biology to translation. While these data provide novel opportunities for discovery, they also pose management and analysis challenges, thus motivating the development of tailored computational solutions. `muon` is a Python framework for multimodal omics.
It introduces multimodal data containers as `MuData` object. The package also provides state of the art methods for multi-omics data integration. `muon` allows the analysis of both unimodal omics and multimodal omics.
BioTuring
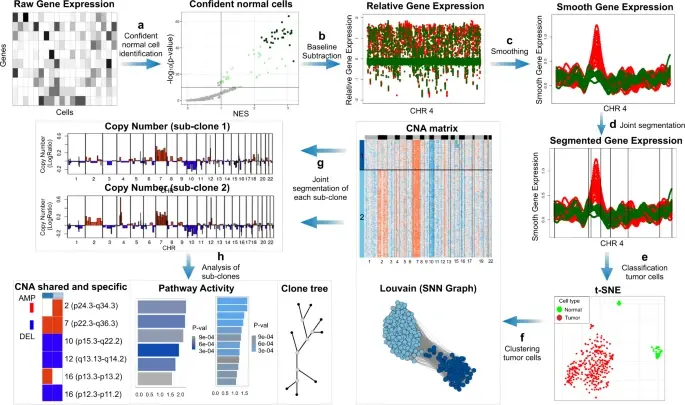
In the realm of cancer research, grasping the intricacies of intratumor heterogeneity and its interplay with the immune system is paramount for deciphering treatment resistance and tumor progression. While single-cell RNA sequencing unveils diverse transcriptional programs, the challenge persists in automatically discerning malignant cells from non-malignant ones within complex datasets featuring varying coverage depths. Thus, there arises a compelling need for an automated solution to this classification conundrum.
SCEVAN (De Falco et al., 2023), a variational algorithm, is designed to autonomously identify the clonal copy number substructure of tumors using single-cell data. It automatically separates malignant cells from non-malignant ones, and subsequently, groups of malignant cells are examined through an optimization-driven joint segmentation process.
BioTuring
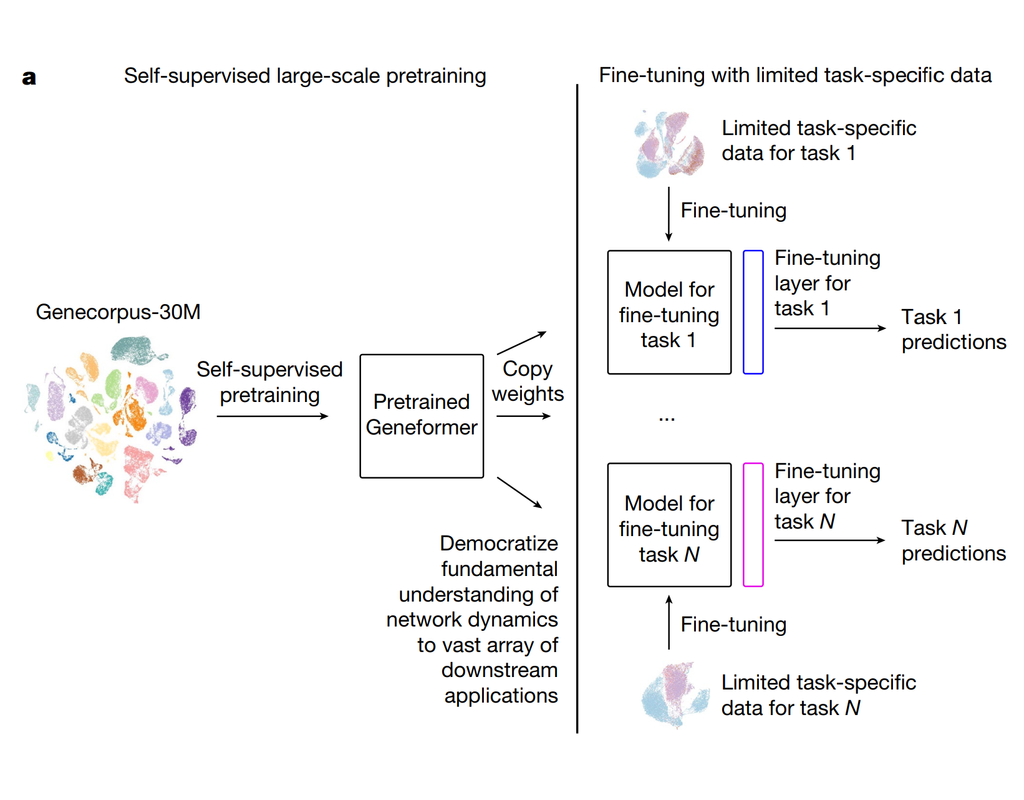
Geneformer is a foundation transformer model pretrained on a large-scale corpus of ~30 million single cell transcriptomes to enable context-aware predictions in settings with limited data in network biology. Here, we will demonstrate a basic workflow to work with ***Geneformer*** models.
These notebooks include the instruction to:
1. Prepare input datasets
2. Finetune Geneformer model to perform specific task
3. Using finetuning models for cell classification and gene classification application
Trends

BioTuring
Single-cell RNA sequencing (scRNA-seq) data have allowed us to investigate cellular heterogeneity and the kinetics of a biological process. Some studies need to understand how cells change state, and corresponding genes during the process, but it is (More)