


Notebooks

Categories


Cells
Premium


BioTuring
The development of large-scale single-cell atlases has allowed describing cell states in a more detailed manner. Meanwhile, current deep leanring methods enable rapid analysis of newly generated query datasets by mapping them into reference atlases.
expiMap (‘explainable programmable mapper’) Lotfollahi, Mohammad, et al. is one of the methods proposed for single-cell reference mapping. Furthermore, it incorporates prior knowledge from gene sets databases or users to analyze query data in the context of known gene programs (GPs).

BioTuring
In this notebook, we present COMMOT (COMMunication analysis by Optimal Transport) to infer cell-cell communication (CCC) in spatial transcriptomic, a package that infers CCC by simultaneously considering numerous ligand–receptor pairs for either spatial transcriptomic data or spatially annotated scRNA-seq data equipped with spatial distances between cells estimated from paired spatial imaging data.
A collective optimal transport method is developed to handle complex molecular interactions and spatial constraints. Furthermore, we introduce downstream analysis tools to infer spatial signaling directionality and genes regulated by signaling using machine learning models.
BioTuring
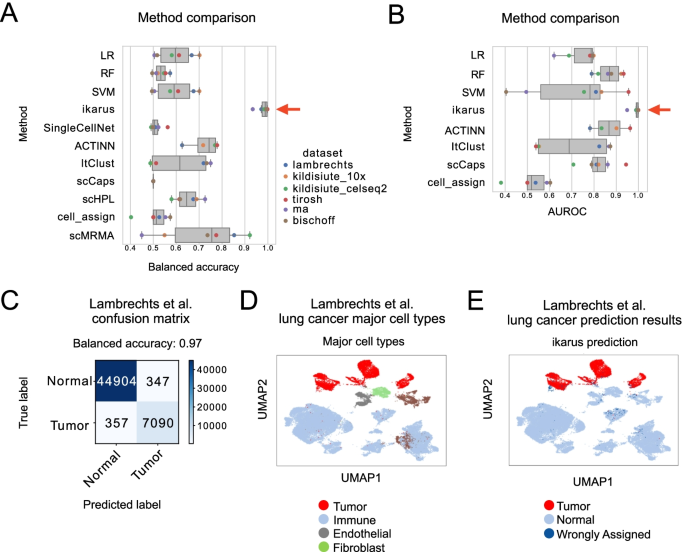
Tumors are complex tissues of cancerous cells surrounded by a heterogeneous cellular microenvironment with which they interact. Single-cell sequencing enables molecular characterization of single cells within the tumor. However, cell annotation—the assignment of cell type or cell state to each sequenced cell—is a challenge, especially identifying tumor cells within single-cell or spatial sequencing experiments.
Here, we propose ikarus, a machine learning pipeline aimed at distinguishing tumor cells from normal cells at the single-cell level. We test ikarus on multiple single-cell datasets, showing that it achieves high sensitivity and specificity in multiple experimental contexts.
**InferCNV** is a Bayesian method, which agglomerates the expression signal of genomically adjointed genes to ascertain whether there is a gain or loss of a certain larger genomic segment. We have used **inferCNV** to call copy number variations in all samples used in the manuscript.
BioTuring
Cell2location is a principled Bayesian model that can resolve fine-grained cell types in spatial transcriptomic data and create comprehensive cellular maps of diverse tissues. Cell2location accounts for technical sources of variation and borrows statistical strength across locations, thereby enabling the integration of single cell and spatial transcriptomics with higher sensitivity and resolution than existing tools. This is achieved by estimating which combination of cell types in which cell abundance could have given the mRNA counts in the spatial data, while modelling technical effects (platform/technology effect, contaminating RNA, unexplained variance).
This tutorial shows how to use cell2location method for spatially resolving fine-grained cell types by integrating 10X Visium data with scRNA-seq reference of cell types. Cell2location is a principled Bayesian model that estimates which combination of cell types in which cell abundance could have given the mRNA counts in the spatial data, while modelling technical effects (platform/technology effect, contaminating RNA, unexplained variance).
Trends
BioTuring
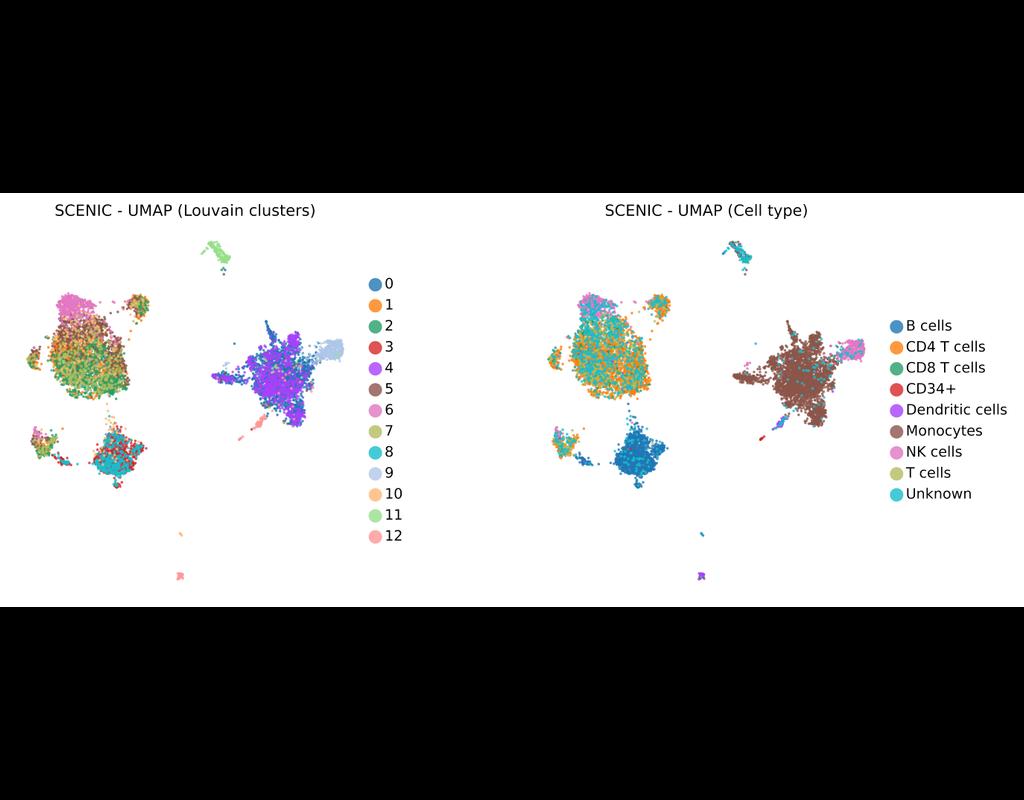
SCENIC Suite is a set of tools to study and decipher gene regulation. Its core is based on SCENIC (Single-Cell Regulatory Network Inference and Clustering) which enables you to infer transcription factors, gene regulatory networks and cell types from(More)