


Notebooks

Categories


Cells
Premium


BioTuring
Single-cell RNA sequencing (scRNA-seq) protocols often face challenges in measuring the expression of all genes within a cell due to various factors, such as technical noise, the sensitivity of scRNA-seq techniques, or sample quality. This limitation gives rise to a need for the prediction of unmeasured gene expression values (also known as dropout imputation) from scRNA-seq data.
ADImpute (Leote A, 2023) is an R package combining several dropout imputation methods, including two existing methods (DrImpute, SAVER), two novel implementations: Network, a gene regulatory network-based approach using gene-gene relationships learned from external data, and Baseline, a method corresponding to a sample-wide average..
This notebook is to illustrate an example workflow of ADImpute on sample datasets loaded from the package. The notebook content is inspired from ADImpute's vignette and modified to demonstrate how the tool works on BioTuring's platform.
BioTuring
scVI-tools (single-cell variational inference tools) is a package for end-to-end analysis of single-cell omics data primarily developed and maintained by the Yosef Lab at UC Berkeley. scvi-tools has two components
- Interface for easy use of a range of probabilistic models for single-cell omics (e.g., scVI, scANVI, totalVI).
- Tools to build new probabilistic models, which are powered by PyTorch, PyTorch Lightning, and Pyro.
BioTuring
The recent development of single-cell RNA-sequencing (scRNA-seq) technology has enabled us to infer cell-type-specific co-expression networks, enhancing our understanding of cell-type-specific biological functions. However, existing methods proposed for this task still face challenges due to unique characteristics in scRNA-seq data, such as high sequencing depth variations across cells and measurement errors.
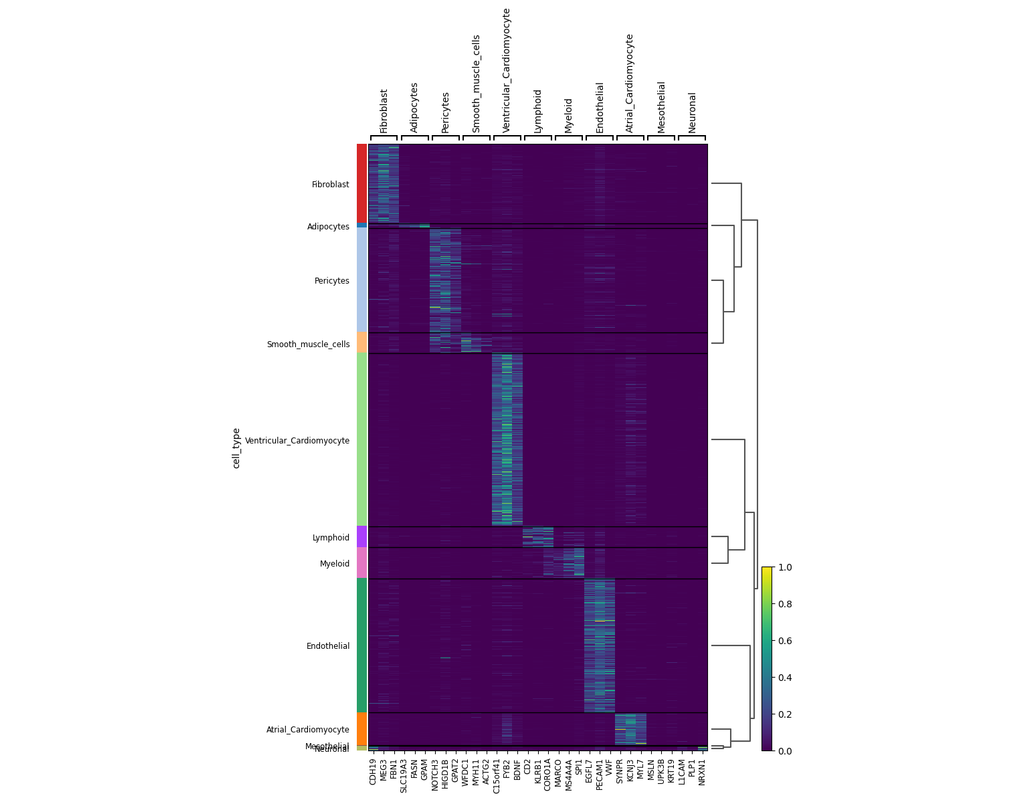
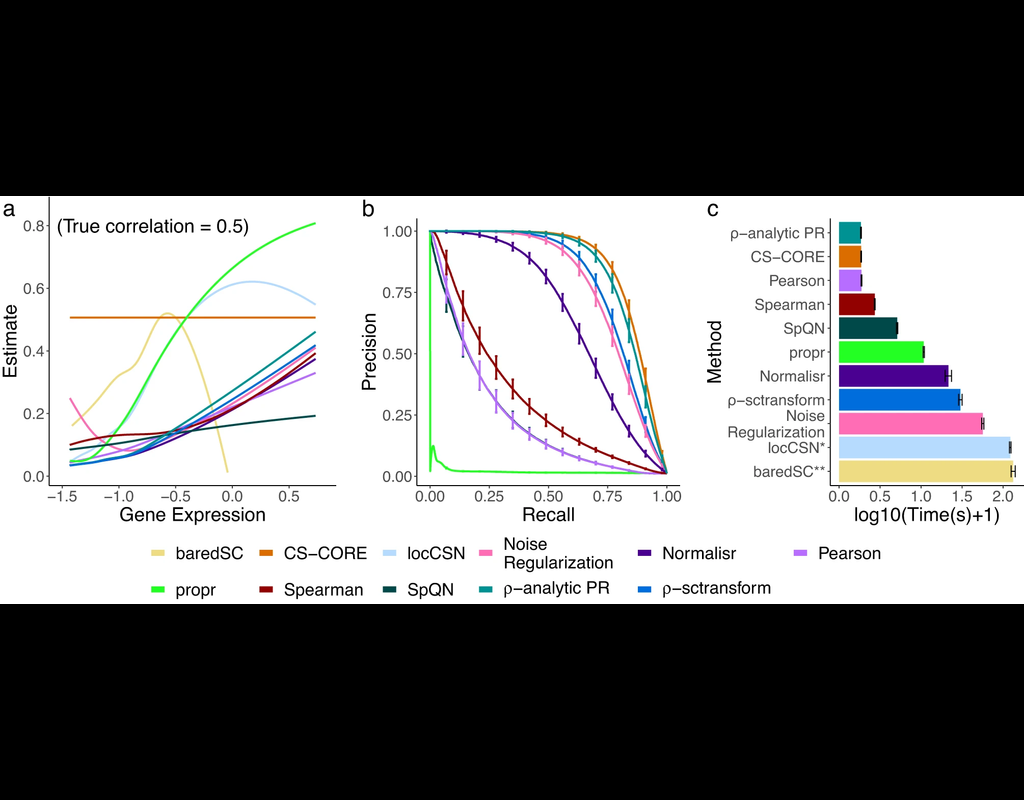
CS-CORE (Su, C., Xu, Z., Shan, X. et al., 2023), an R package for cell-type-specific co-expression inference, explicitly models sequencing depth variations and measurement errors in scRNA-seq data.
In this notebook, we will illustrate an example workflow of CS-CORE using a dataset of Peripheral Blood Mononuclear Cells (PBMC) from COVID patients and healthy controls (Wilk et al., 2020). The notebook content is inspired by CS-CORE's vignette and modified to demonstrate how the tool works on BioTuring's platform.

BioTuring
CellRank2 (Weiler et al, 2023) is a powerful framework for studying cellular fate using single-cell RNA sequencing data. It can handle millions of cells and different data types efficiently. This tool can identify cell fate and probabilities across various data sets. It also allows for analyzing transitions over time and uncovering key genes in developmental processes. Additionally, CellRank2 estimates cell-specific transcription and degradation rates, aiding in understanding differentiation trajectories and regulatory mechanisms.
In this notebook, we will use a primary tumor sample of patient T71 from the dataset GSE137804 (Dong R. et al, 2020) as an example. We have performed RNA-velocity analysis and pseudotime calculation on this dataset in scVelo (Bergen et al, 2020) notebook. The output will be then loaded into this CellRank2 notebook for further analysis.
This notebook is based on the tutorial provided on CellRank2 documentation. We have modified the notebook and changed the input data to show how the tool works on BioTuring's platform.
Trends

BioTuring
Single-cell RNA-seq datasets in diverse biological and clinical conditions provide great opportunities for the full transcriptional characterization of cell types.
However, the integration of these datasets is challeging as they remain biological(More)