


Notebooks

Categories


Cells
Premium


BioTuring
Single-cell RNA data allows cell-cell communications (***CCC***) methods to infer CCC at either the individual cell or cell cluster/cell type level, but physical distances between cells are not preserved Almet, Axel A., et al., (2021). On the other hand, spatial data provides spatial distances between cells, but single-cell or gene resolution is potentially lost. Therefore, integrating two types of data in a proper manner can complement their strengths and limitations, from that improve CCC analysis.
In this pipeline, we analyze CCC on Visium data with single-cell data as a reference. The pipeline includes 4 sub-notebooks as following
01-deconvolution: This step involves deconvolution and cell type annotation for Visium data, with cell type information obtained from a relevant single-cell dataset. The deconvolution method is SpatialDWLS which is integrated in Giotto package.
02-giotto: performs spatial based CCC and expression based CCC on Visium data using Giotto method.
03-nichenet: performs spatial based CCC and expression based CCC on Visium data using NicheNet method.
04-visualization: visualizes CCC results obtained from Giotto and NicheNet.
BioTuring
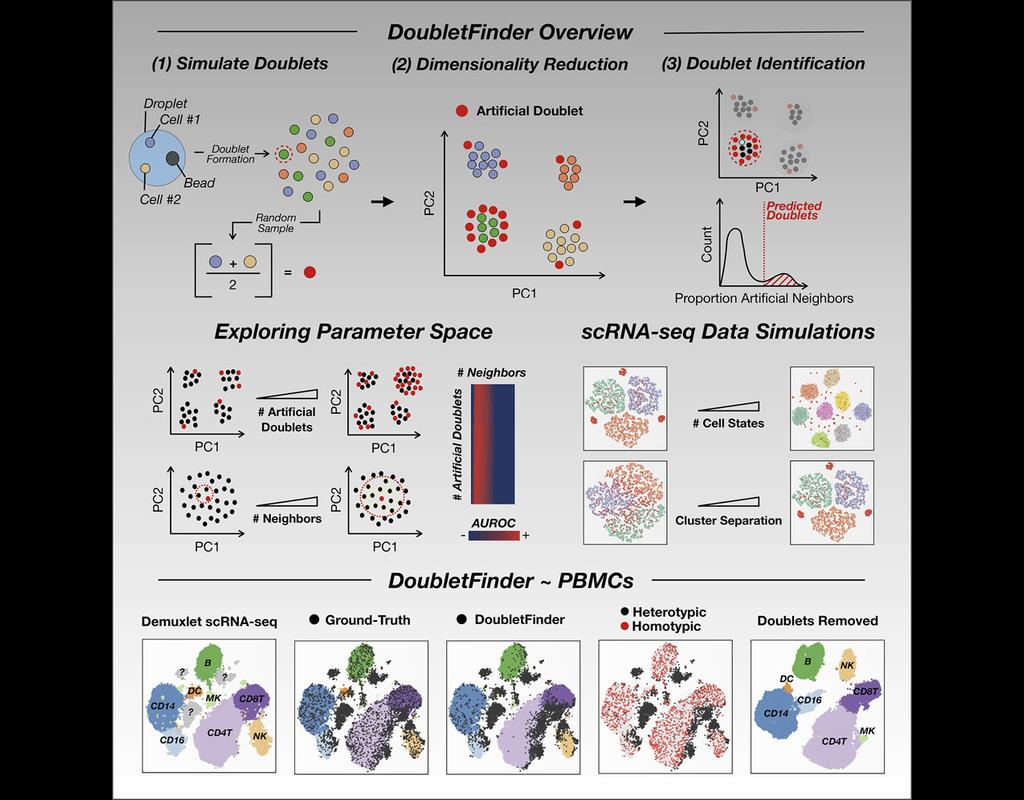
Single-cell RNA sequencing (scRNA-seq) data often encountered technical artifacts called "doublets" which are two cells that are sequenced under the same cellular barcode.
Doublets formed from different cell types or states are called heterotypic and homotypic otherwise. These factors constrain cell throughput and may result in misleading biological interpretations.
DoubletFinder (McGinnis, Murrow, and Gartner 2019) is one of the methods proposed for doublet detection. In this notebook, we will illustrate an example workflow of DoubletFinder. We use a 10x Genomics dataset which captures peripheral blood mononuclear cells (PBMCs) from a healthy donor stained with a panel of 31 TotalSeq™-B antibodies (BioLegend).
BioTuring
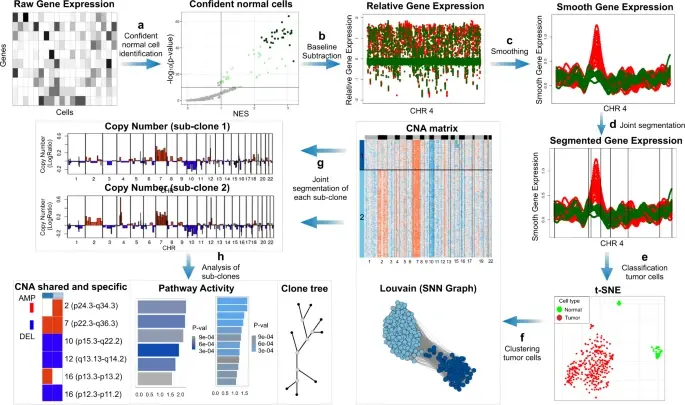
In the realm of cancer research, grasping the intricacies of intratumor heterogeneity and its interplay with the immune system is paramount for deciphering treatment resistance and tumor progression. While single-cell RNA sequencing unveils diverse transcriptional programs, the challenge persists in automatically discerning malignant cells from non-malignant ones within complex datasets featuring varying coverage depths. Thus, there arises a compelling need for an automated solution to this classification conundrum.
SCEVAN (De Falco et al., 2023), a variational algorithm, is designed to autonomously identify the clonal copy number substructure of tumors using single-cell data. It automatically separates malignant cells from non-malignant ones, and subsequently, groups of malignant cells are examined through an optimization-driven joint segmentation process.
BioTuring
Cell2location is a principled Bayesian model that can resolve fine-grained cell types in spatial transcriptomic data and create comprehensive cellular maps of diverse tissues. Cell2location accounts for technical sources of variation and borrows statistical strength across locations, thereby enabling the integration of single cell and spatial transcriptomics with higher sensitivity and resolution than existing tools. This is achieved by estimating which combination of cell types in which cell abundance could have given the mRNA counts in the spatial data, while modelling technical effects (platform/technology effect, contaminating RNA, unexplained variance).
This tutorial shows how to use cell2location method for spatially resolving fine-grained cell types by integrating 10X Visium data with scRNA-seq reference of cell types. Cell2location is a principled Bayesian model that estimates which combination of cell types in which cell abundance could have given the mRNA counts in the spatial data, while modelling technical effects (platform/technology effect, contaminating RNA, unexplained variance).
Trends
BioTuring
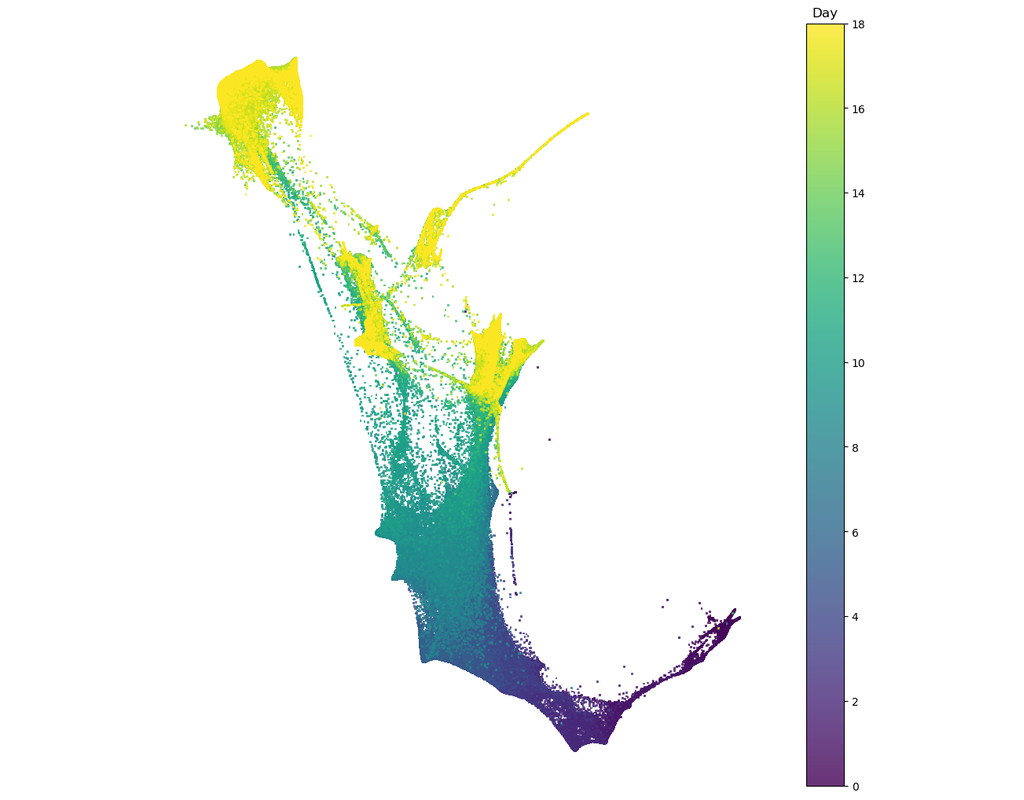
Single cell RNA-seq allows us to profile the diversity of cells along a developmental time-course. However, we cannot directly observe cellular trajectories because the measurement process is destructive. Waddington-OT is designed to infer the tempor(More)