


Notebooks

Categories


Cells
Premium


BioTuring
Build single-cell trajectories with the software that introduced **pseudotime**. Find out about cell fate decisions and the genes regulated as they're made.
Group and classify your cells based on gene expression. Identify new cell types and states and the genes that distinguish them.
Find genes that vary between cell types and states, over trajectories, or in response to perturbations using statistically robust, flexible differential analysis.
In development, disease, and throughout life, cells transition from one state to another. Monocle introduced the concept of **pseudotime**, which is a measure of how far a cell has moved through biological progress.
Many researchers are using single-cell RNA-Seq to discover new cell types. Monocle 3 can help you purify them or characterize them further by identifying key marker genes that you can use in follow-up experiments such as immunofluorescence or flow sorting.
**Single-cell trajectory analysis** shows how cells choose between one of several possible end states. The new reconstruction algorithms introduced in Monocle 3 can robustly reveal branching trajectories, along with the genes that cells use to navigate these decisions.

BioTuring
Advances in multi-omics have led to an explosion of multimodal datasets to address questions from basic biology to translation. While these data provide novel opportunities for discovery, they also pose management and analysis challenges, thus motivating the development of tailored computational solutions. `muon` is a Python framework for multimodal omics.
It introduces multimodal data containers as `MuData` object. The package also provides state of the art methods for multi-omics data integration. `muon` allows the analysis of both unimodal omics and multimodal omics.

BioTuring
Charting an organs’ biological atlas requires us to spatially resolve the entire single-cell transcriptome, and to relate such cellular features to the anatomical scale. Single-cell and single-nucleus RNA-seq (sc/snRNA-seq) can profile cells comprehensively, but lose spatial information.
Spatial transcriptomics allows for spatial measurements, but at lower resolution and with limited sensitivity. Targeted in situ technologies solve both issues, but are limited in gene throughput. To overcome these limitations we present Tangram, a method that aligns sc/snRNA-seq data to various forms of spatial data collected from the same region, including MERFISH, STARmap, smFISH, Spatial Transcriptomics (Visium) and histological images.
**Tangram** can map any type of sc/snRNA-seq data, including multimodal data such as those from SHARE-seq, which we used to reveal spatial patterns of chromatin accessibility. We demonstrate Tangram on healthy mouse brain tissue, by reconstructing a genome-wide anatomically integrated spatial map at single-cell resolution of the visual and somatomotor areas.

BioTuring
Many spatially resolved transcriptomic technologies do not have single-cell resolution but measure the average gene expression for each spot from a mixture of cells of potentially heterogeneous cell types.
Here, we introduce a deconvolution method, conditional autoregressive-based deconvolution (CARD), that combines cell-type-specific expression information from single-cell RNA sequencing (scRNA-seq) with correlation in cell-type composition across tissue locations. Modeling spatial correlation allows us to borrow the cell-type composition information across locations, improving accuracy of deconvolution even with a mismatched scRNA-seq reference.
**CARD** can also impute cell-type compositions and gene expression levels at unmeasured tissue locations to enable the construction of a refined spatial tissue map with a resolution arbitrarily higher than that measured in the original study and can perform deconvolution without an scRNA-seq reference.
Applications to four datasets, including a pancreatic cancer dataset, identified multiple cell types and molecular markers with distinct spatial localization that define the progression, heterogeneity and compartmentalization of pancreatic cancer.
Trends
BioTuring
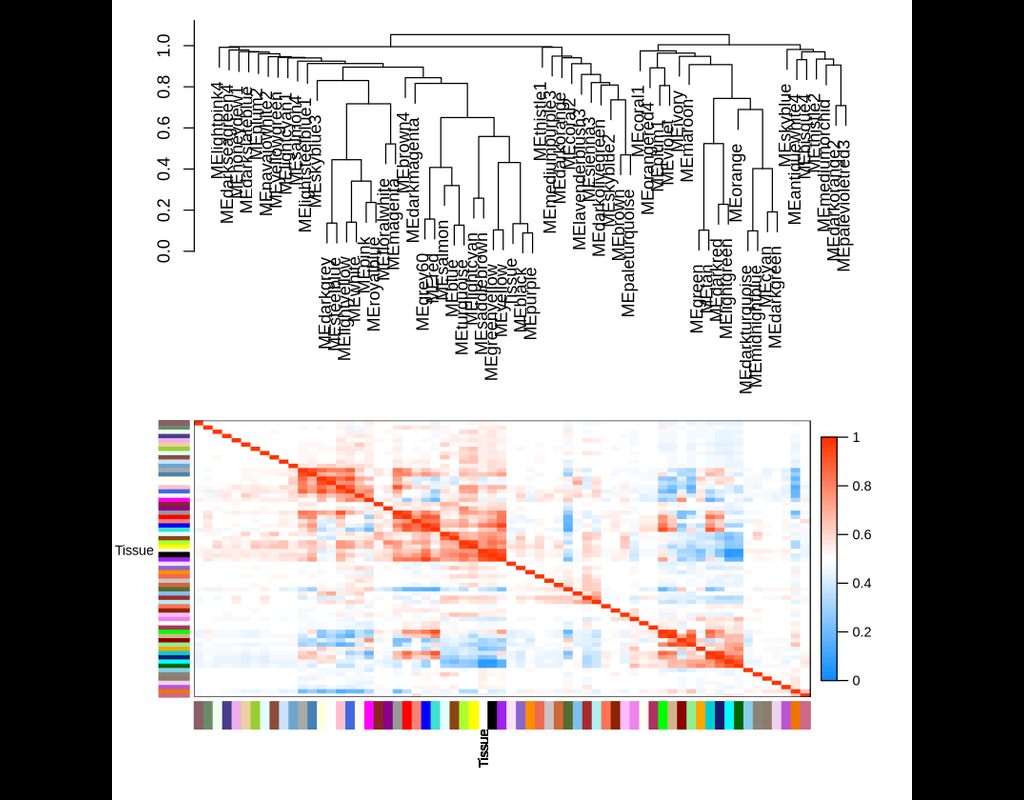
WGCNA: an R package for Weighted Gene Correlation Network Analysis
Correlation networks are increasingly being used in bioinformatics applications. For example, weighted gene co-expression network analysis is a systems biology method for describing (More)