


Notebooks

Categories


Cells
Premium

BioTuring
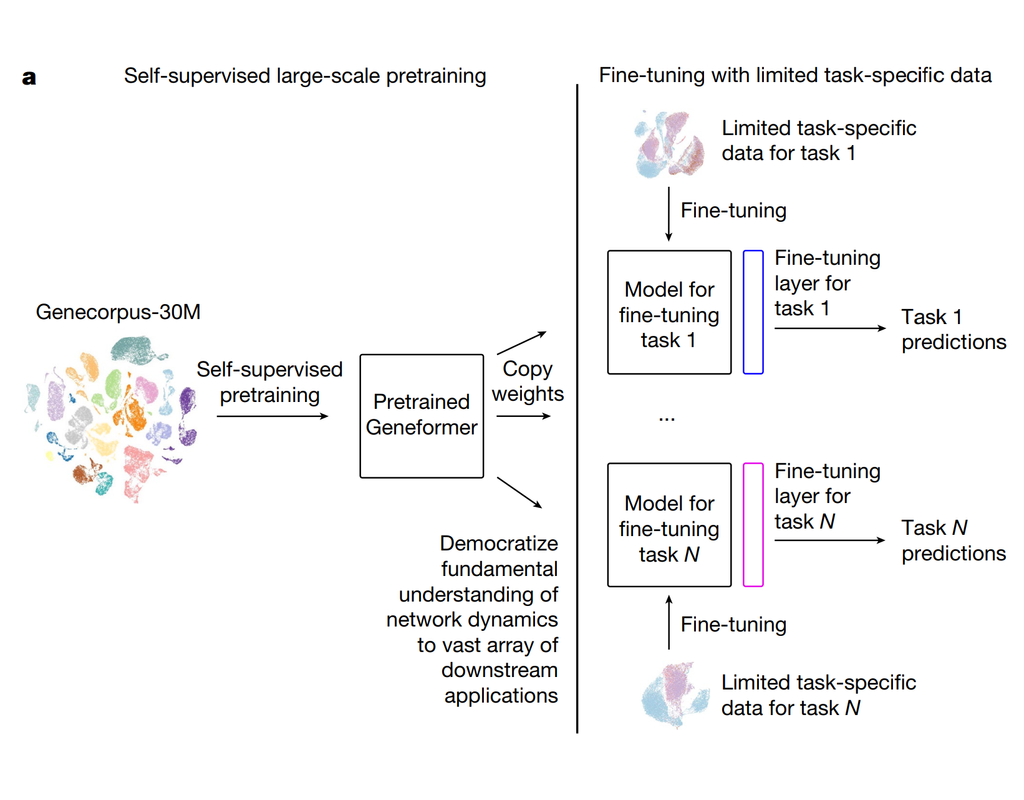
Geneformer is a foundation transformer model pretrained on a large-scale corpus of ~30 million single cell transcriptomes to enable context-aware predictions in settings with limited data in network biology. Here, we will demonstrate a basic workflow to work with ***Geneformer*** models.
These notebooks include the instruction to:
1. Prepare input datasets
2. Finetune Geneformer model to perform specific task
3. Using finetuning models for cell classification and gene classification application
BioTuring
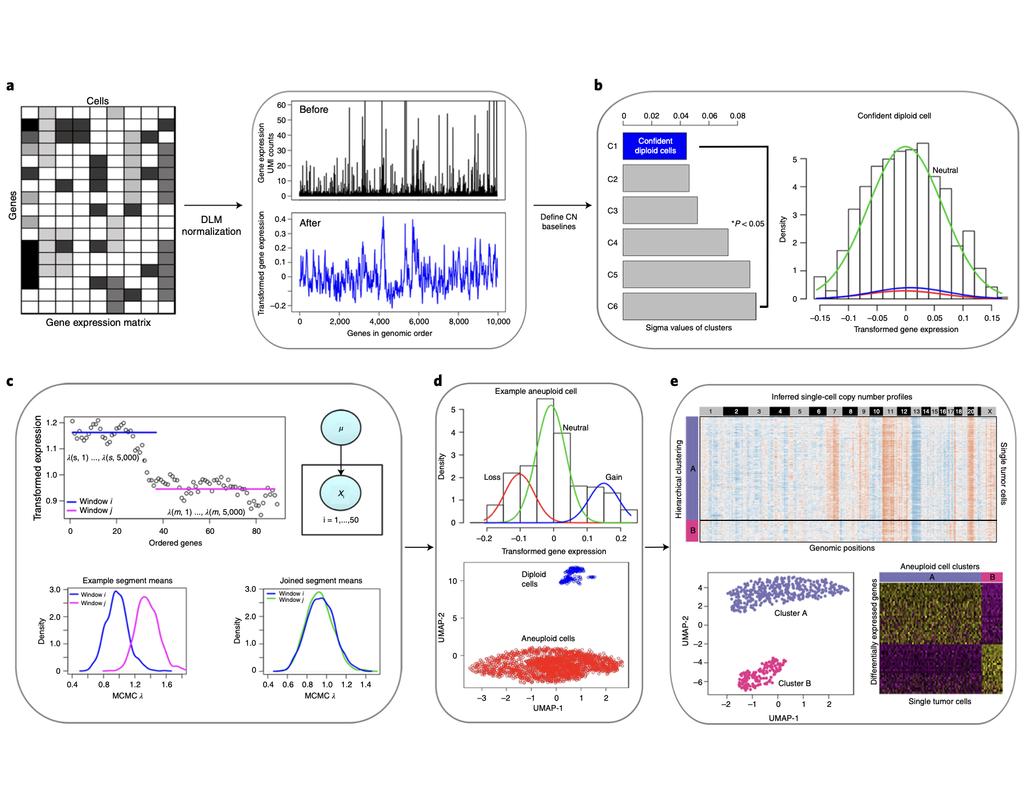
Classification of tumor and normal cells in the tumor microenvironment from scRNA-seq data is an ongoing challenge in human cancer study.
Copy number karyotyping of aneuploid tumors (***copyKAT***) (Gao, Ruli, et al., 2021) is a method proposed for identifying copy number variations in single-cell transcriptomics data. It is used to predict aneuploid tumor cells and delineate the clonal substructure of different subpopulations that coexist within the tumor mass.
In this notebook, we will illustrate a basic workflow of CopyKAT based on the tutorial provided on CopyKAT's repository. We will use a dataset of triple negative cancer tumors sequenced by 10X Chromium 3'-scRNAseq (GSM4476486) as an example. The dataset contains 20,990 features across 1,097 cells. We have modified the notebook to demonstrate how the tool works on BioTuring's platform.

BioTuring
Recent technological advancements have enabled spatially resolved transcriptomic profiling but at multi-cellular pixel resolution, thereby hindering the identification of cell-type-specific spatial patterns and gene expression variation.
To address this challenge, we develop STdeconvolve as a reference-free approach to deconvolve underlying cell types comprising such multi-cellular pixel resolution spatial transcriptomics (ST) datasets. Using simulated as well as real ST datasets from diverse spatial transcriptomics technologies comprising a variety of spatial resolutions such as Spatial Transcriptomics, 10X Visium, DBiT-seq, and Slide-seq, we show that STdeconvolve can effectively recover cell-type transcriptional profiles and their proportional representation within pixels without reliance on external single-cell transcriptomics references.
**STdeconvolve** provides comparable performance to existing reference-based methods when suitable single-cell references are available, as well as potentially superior performance when suitable single-cell references are not available.
STdeconvolve is available as an open-source R software package with the source code available at https://github.com/JEFworks-Lab/STdeconvolve .

BioTuring
Expanded CRISPR-compatible CITE-seq (ECCITE-seq) which is built upon pooled CRISPR screens, allows to simultaneously measure transcriptomes, surface protein levels, and single-guide RNA (sgRNA) sequences at single-cell resolution. The technique enables multimodal characterization of each perturbation and effect exploration. However, it also encounters heterogeneity and complexity which can cause substantial noise into downstream analyses.
Mixscape (Papalexi, Efthymia, et al., 2021) is a computational framework proposed to substantially improve the signal-to-noise ratio in single-cell perturbation screens by identifying and removing confounding sources of variation.
In this notebooks, we demonstrate Mixscape's features using pertpy - a Python package offering a range of tools for perturbation analysis. The original pipeline of Mixscape implemented in R can be found here.
Trends

BioTuring
Charting an organs’ biological atlas requires us to spatially resolve the entire single-cell transcriptome, and to relate such cellular features to the anatomical scale. Single-cell and single-nucleus RNA-seq (sc/snRNA-seq) can profile cells compre(More)