


Notebooks

Categories


Cells
Premium


BioTuring
The development of large-scale single-cell atlases has allowed describing cell states in a more detailed manner. Meanwhile, current deep leanring methods enable rapid analysis of newly generated query datasets by mapping them into reference atlases.
expiMap (‘explainable programmable mapper’) Lotfollahi, Mohammad, et al. is one of the methods proposed for single-cell reference mapping. Furthermore, it incorporates prior knowledge from gene sets databases or users to analyze query data in the context of known gene programs (GPs).

BioTuring
Cell–cell communication mediated by ligand–receptor complexes is critical to coordinating diverse biological processes, such as development, differentiation and inflammation.
To investigate how the context-dependent crosstalk of different cell types enables physiological processes to proceed, we developed CellPhoneDB, a novel repository of ligands, receptors and their interactions. In contrast to other repositories, our database takes into account the subunit architecture of both ligands and receptors, representing heteromeric complexes accurately.
We integrated our resource with a statistical framework that predicts enriched cellular interactions between two cell types from single-cell transcriptomics data. Here, we outline the structure and content of our repository, provide procedures for inferring cell–cell communication networks from single-cell RNA sequencing data and present a practical step-by-step guide to help implement the protocol.
CellPhoneDB v.2.0 is an updated version of our resource that incorporates additional functionalities to enable users to introduce new interacting molecules and reduces the time and resources needed to interrogate large datasets.
CellPhoneDB v.2.0 is publicly available, both as code and as a user-friendly web interface; it can be used by both experts and researchers with little experience in computational genomics.
In our protocol, we demonstrate how to evaluate meaningful biological interactions with CellPhoneDB v.2.0 using published datasets. This protocol typically takes ~2 h to complete, from installation to statistical analysis and visualization, for a dataset of ~10 GB, 10,000 cells and 19 cell types, and using five threads.

BioTuring
Expanded CRISPR-compatible CITE-seq (ECCITE-seq) which is built upon pooled CRISPR screens, allows to simultaneously measure transcriptomes, surface protein levels, and single-guide RNA (sgRNA) sequences at single-cell resolution. The technique enables multimodal characterization of each perturbation and effect exploration. However, it also encounters heterogeneity and complexity which can cause substantial noise into downstream analyses.
Mixscape (Papalexi, Efthymia, et al., 2021) is a computational framework proposed to substantially improve the signal-to-noise ratio in single-cell perturbation screens by identifying and removing confounding sources of variation.
In this notebooks, we demonstrate Mixscape's features using pertpy - a Python package offering a range of tools for perturbation analysis. The original pipeline of Mixscape implemented in R can be found here.
BioTuring
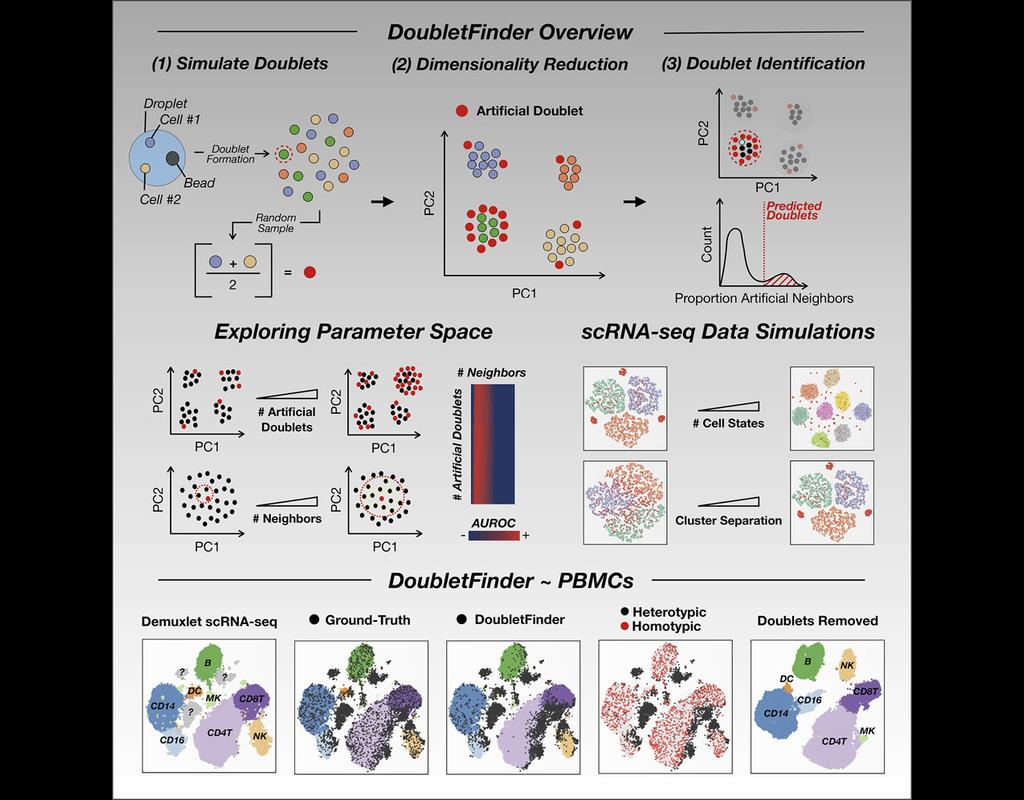
Single-cell RNA sequencing (scRNA-seq) data often encountered technical artifacts called "doublets" which are two cells that are sequenced under the same cellular barcode.
Doublets formed from different cell types or states are called heterotypic and homotypic otherwise. These factors constrain cell throughput and may result in misleading biological interpretations.
DoubletFinder (McGinnis, Murrow, and Gartner 2019) is one of the methods proposed for doublet detection. In this notebook, we will illustrate an example workflow of DoubletFinder. We use a 10x Genomics dataset which captures peripheral blood mononuclear cells (PBMCs) from a healthy donor stained with a panel of 31 TotalSeq™-B antibodies (BioLegend).
Trends
BioTuring
The simultaneous measurement of multiple modalities represents an exciting frontier for single-cell genomics and necessitates computational methods that can define cellular states based on multimodal data.
Here, we introduce "weighted-nearest nei(More)