


Notebooks

Categories


Cells
Premium


BioTuring
The development of large-scale single-cell atlases has allowed describing cell states in a more detailed manner. Meanwhile, current deep leanring methods enable rapid analysis of newly generated query datasets by mapping them into reference atlases.
expiMap (‘explainable programmable mapper’) Lotfollahi, Mohammad, et al. is one of the methods proposed for single-cell reference mapping. Furthermore, it incorporates prior knowledge from gene sets databases or users to analyze query data in the context of known gene programs (GPs).
BioTuring
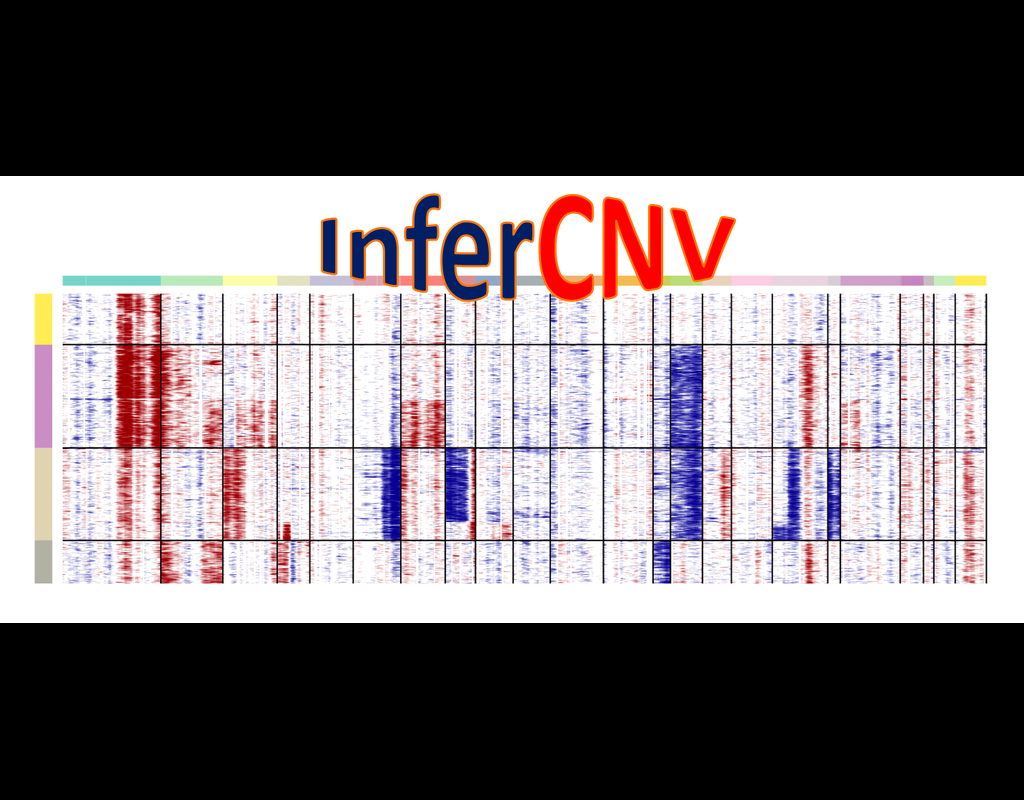
InferCNV is used to explore tumor single cell RNA-Seq data to identify evidence for somatic large-scale chromosomal copy number alterations, such as gains or deletions of entire chromosomes or large segments of chromosomes. This is done by exploring expression intensity of genes across positions of tumor genome in comparison to a set of reference 'normal' cells. A heatmap is generated illustrating the relative expression intensities across each chromosome, and it often becomes readily apparent as to which regions of the tumor genome are over-abundant or less-abundant as compared to that of normal cells.
**Infercnvpy** is a scalable python library to infer copy number variation (CNV) events from single cell transcriptomics data. It is heavliy inspired by InferCNV, but plays nicely with scanpy and is much more scalable.

BioTuring
Advances in multi-omics have led to an explosion of multimodal datasets to address questions from basic biology to translation. While these data provide novel opportunities for discovery, they also pose management and analysis challenges, thus motivating the development of tailored computational solutions. `muon` is a Python framework for multimodal omics.
It introduces multimodal data containers as `MuData` object. The package also provides state of the art methods for multi-omics data integration. `muon` allows the analysis of both unimodal omics and multimodal omics.

BioTuring
Mapping out the coarse-grained connectivity structures of complex manifolds
Biological systems often change over time, as old cells die and new cells are created through differentiation from progenitor cells. This means that at any given time, not all cells will be at the same stage of development. In this sense, a single-cell sample could contain cells at different stages of differentiation. By analyzing the data, we can identify which cells are at which stages and build a model for their biological transitions.
By quantifying the connectivity of partitions (groups, clusters) of the single-cell graph, partition-based graph abstraction (PAGA) generates a much simpler abstracted graph (PAGA graph) of partitions, in which edge weights represent confidence in the presence of connections.
In this notebook, we will introduce the concept of single-cell Trajectory Analysis using PAGA (Partition-based graph abstraction) in the context of hematopoietic differentiation.
Trends
BioTuring
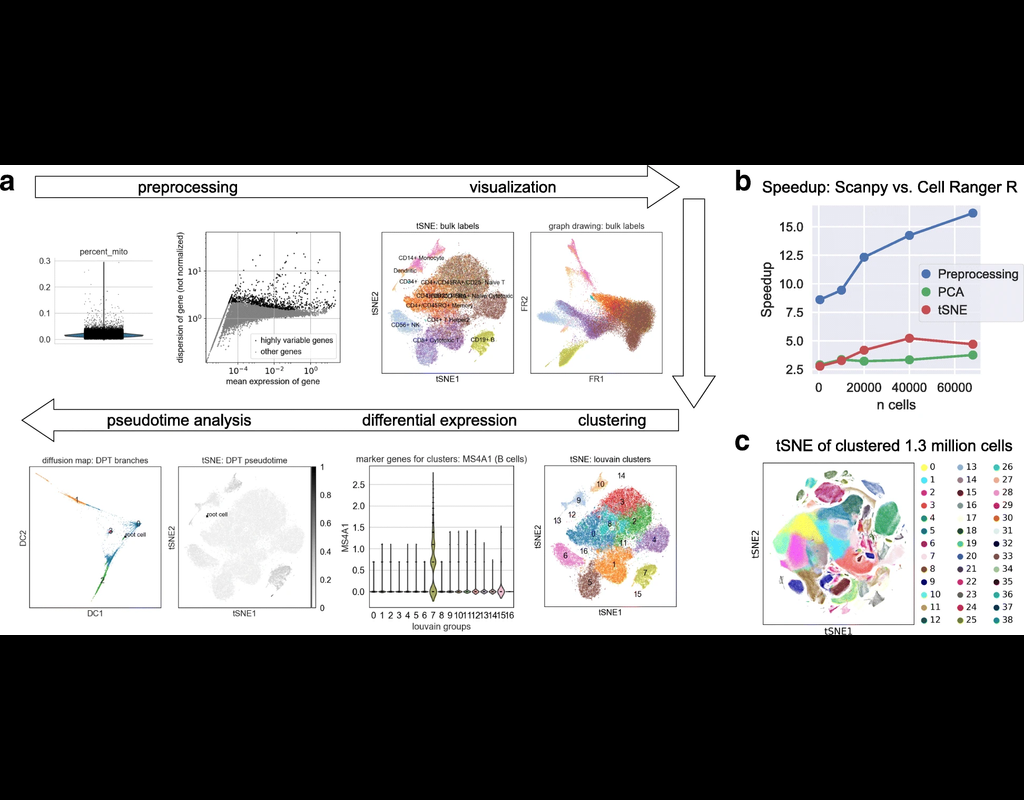
SCANPY integrates the analysis possibilities of established R-based frameworks and provides them in a scalable and modular form.
Specifically, SCANPY provides preprocessing comparable to SEURAT and CELL RANGER, visualization through TSNE, graph-d(More)