


Notebooks

Categories


Cells
Premium


BioTuring
Spatially resolved gene expression profiles are key to understand tissue organization and function. However, spatial transcriptomics (ST) profiling techniques lack single-cell resolution and require a combination with single-cell RNA sequencing (scRNA-seq) information to deconvolute the spatially indexed datasets.
Leveraging the strengths of both data types, we developed SPOTlight, a computational tool that enables the integration of ST with scRNA-seq data to infer the location of cell types and states within a complex tissue. SPOTlight is centered around a seeded non-negative matrix factorization (NMF) regression, initialized using cell-type marker genes and non-negative least squares (NNLS) to subsequently deconvolute ST capture locations (spots).
Simulating varying reference quantities and qualities, we confirmed high prediction accuracy also with shallowly sequenced or small-sized scRNA-seq reference datasets. SPOTlight deconvolution of the mouse brain correctly mapped subtle neuronal cell states of the cortical layers and the defined architecture of the hippocampus. In human pancreatic cancer, we successfully segmented patient sections and further fine-mapped normal and neoplastic cell states.
Trained on an external single-cell pancreatic tumor references, we further charted the localization of clinical-relevant and tumor-specific immune cell states, an illustrative example of its flexible application spectrum and future potential in digital pathology.
BioTuring
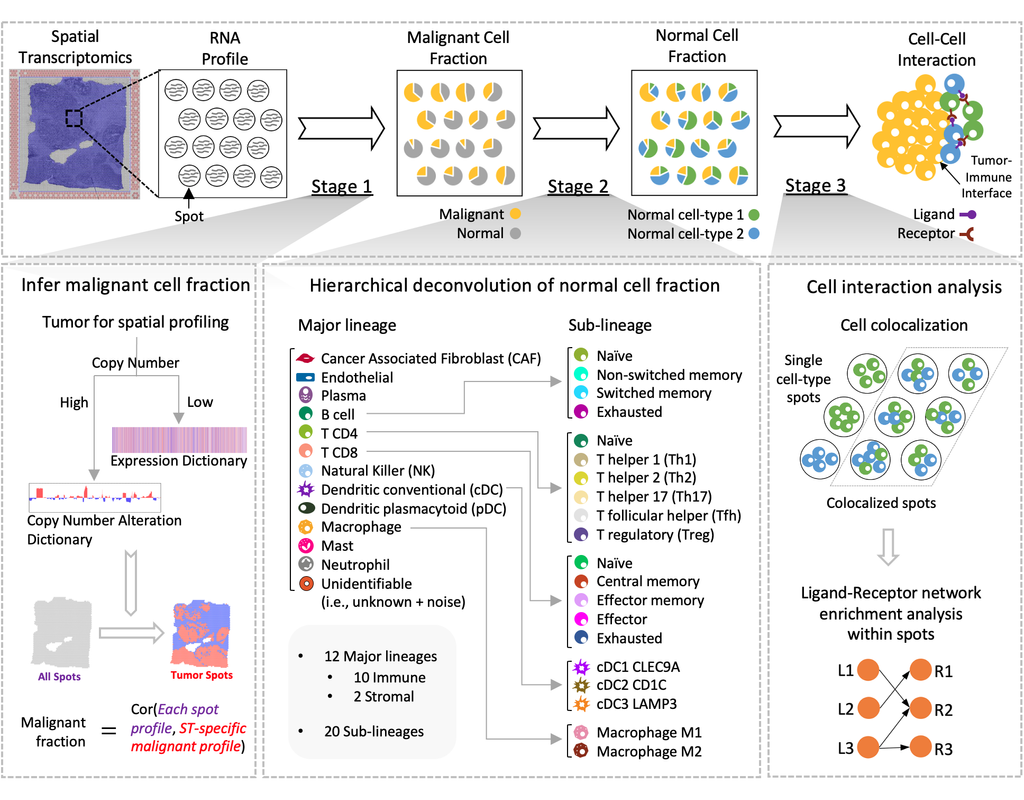
Spatial transcriptomics (ST) technology has allowed to capture of topographical gene expression profiling of tumor tissues, but single-cell resolution is potentially lost. Identifying cell identities in ST datasets from tumors or other samples remains challenging for existing cell-type deconvolution methods.
Spatial Cellular Estimator for Tumors (SpaCET) is an R package for analyzing cancer ST datasets to estimate cell lineages and intercellular interactions in the tumor microenvironment. Generally, SpaCET infers the malignant cell fraction through a gene pattern dictionary, then calibrates local cell densities and determines immune and stromal cell lineage fractions using a constrained regression model. Finally, the method can reveal putative cell-cell interactions in the tumor microenvironment.
In this notebook, we will illustrate an example workflow for cell type deconvolution and interaction analysis on breast cancer ST data from 10X Visium. The notebook is inspired by SpaCET's vignettes and modified to demonstrate how the tool works on BioTuring's platform.
BioTuring
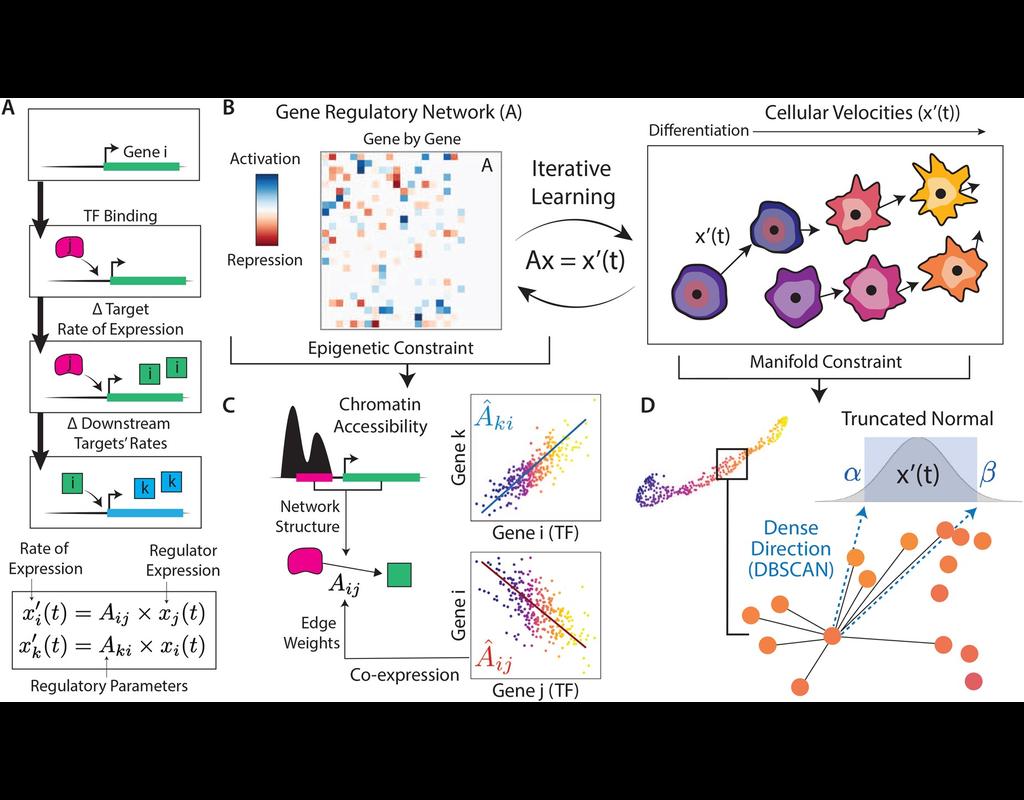
In the realm of transcriptional dynamics, understanding the intricate interplay of regulatory proteins is crucial for deciphering processes ranging from normal development to disease progression. However, traditional RNA velocity methods often overlook the underlying regulatory drivers of gene expression changes over time. This gap in knowledge hinders our ability to unravel the mechanistic intricacies of these dynamic processes.
scKINETICs (Key regulatory Interaction NETwork for Inferring Cell Speed) (Burdziak et al, 2023) offers a dynamic model for gene expression changes that simultaneously learns per-cell transcriptional velocities and a governing gene regulatory network. By employing an expectation-maximization approach, scKINETICS quantifies the impact of each regulatory element on its target genes, incorporating insights from epigenetic data, gene-gene coexpression patterns and constraints dictated by the phenotypic manifold.

BioTuring
Single-cell RNA-seq datasets in diverse biological and clinical conditions provide great opportunities for the full transcriptional characterization of cell types.
However, the integration of these datasets is challeging as they remain biological and techinical differences. **Harmony** is an algorithm allowing fast, sensitive and accurate single-cell data integration.
Trends

BioTuring
Recent technological advancements have enabled spatially resolved transcriptomic profiling but at multi-cellular pixel resolution, thereby hindering the identification of cell-type-specific spatial patterns and gene expression variation.
To addre(More)