


Notebooks

Categories


Cells
Premium


BioTuring
Single-cell RNA sequencing methods can profile the transcriptomes of single cells but cannot preserve spatial information. Conversely, spatial transcriptomics assays can profile spatial regions in tissue sections but do not have single-cell resolution.
Here, Runmin Wei (Siyuan He, Shanshan Bai, Emi Sei, Min Hu, Alastair Thompson, Ken Chen, Savitri Krishnamurthy & Nicholas E. Navin) developed a computational method called CellTrek that combines these two datasets to achieve single-cell spatial mapping through coembedding and metric learning approaches. They benchmarked CellTrek using simulation and in situ hybridization datasets, which demonstrated its accuracy and robustness.
They then applied CellTrek to existing mouse brain and kidney datasets and showed that CellTrek can detect topological patterns of different cell types and cell states. They performed single-cell RNA sequencing and spatial transcriptomics experiments on two ductal carcinoma in situ tissues and applied CellTrek to identify tumor subclones that were restricted to different ducts, and specific T-cell states adjacent to the tumor areas.
BioTuring
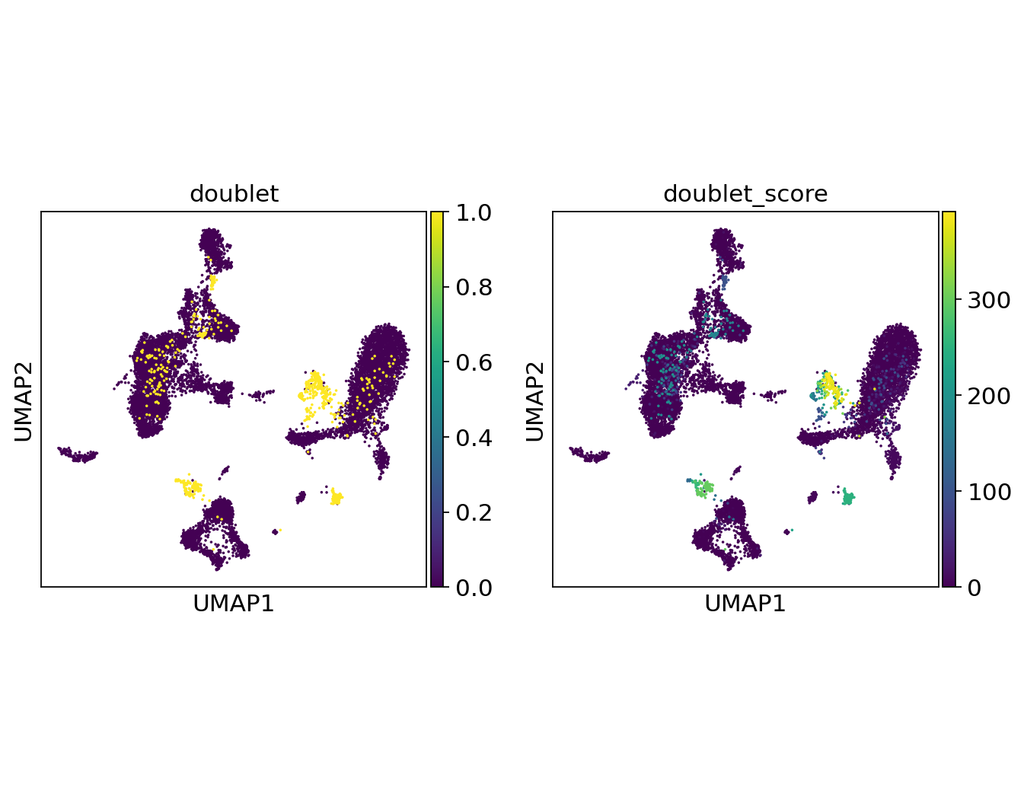
Doublets are a characteristic error source in droplet-based single-cell sequencing data where two cells are encapsulated in the same oil emulsion and are tagged with the same cell barcode. Across type doublets manifest as fictitious phenotypes that can be incorrectly interpreted as novel cell types. DoubletDetection present a novel, fast, unsupervised classifier to detect across-type doublets in single-cell RNA-sequencing data that operates on a count matrix and imposes no experimental constraints.
This classifier leverages the creation of in silico synthetic doublets to determine which cells in the
input count matrix have gene expression that is best explained by the combination of distinct cell
types in the matrix.
In this notebook, we will illustrate an example workflow for detecting doublets in single-cell RNA-seq count matrices.

BioTuring
Single-cell RNA-seq datasets in diverse biological and clinical conditions provide great opportunities for the full transcriptional characterization of cell types.
However, the integration of these datasets is challeging as they remain biological and techinical differences. **Harmony** is an algorithm allowing fast, sensitive and accurate single-cell data integration.

BioTuring
In this notebook, we present COMMOT (COMMunication analysis by Optimal Transport) to infer cell-cell communication (CCC) in spatial transcriptomic, a package that infers CCC by simultaneously considering numerous ligand–receptor pairs for either spatial transcriptomic data or spatially annotated scRNA-seq data equipped with spatial distances between cells estimated from paired spatial imaging data.
A collective optimal transport method is developed to handle complex molecular interactions and spatial constraints. Furthermore, we introduce downstream analysis tools to infer spatial signaling directionality and genes regulated by signaling using machine learning models.
Trends

BioTuring
Cell–cell communication mediated by ligand–receptor complexes is critical to coordinating diverse biological processes, such as development, differentiation and inflammation.
To investigate how the context-dependent crosstalk of different cel(More)