


Notebooks

Categories


Cells
Premium


BioTuring
The development of immune checkpoint-based immunotherapies has been a major advancement in the treatment of cancer, with a subset of patients exhibiting durable clinical responses. A predictive biomarker for immunotherapy response is the pre-existing T-cell infiltration in the tumor immune microenvironment (TIME).
Bulk transcriptomics-based approaches can quantify the degree of T-cell infiltration using deconvolution methods and identify additional markers of inflamed/cold cancers at the bulk level. However, bulk techniques are unable to identify biomarkers of individual cell types. Although single-cell RNA sequencing (scRNAseq) assays are now being used to profile the TIME, to our knowledge there is no method of identifying patients with a T-cell inflamed TIME from scRNAseq data. Here, we describe a method, iBRIDGE, which integrates reference bulk RNAseq data with the malignant subset of scRNAseq datasets to identify patients with a T-cell inflamed TIME.
Utilizing two datasets with matched bulk data, we show iBRIDGE results correlated highly with bulk assessments (0.85 and 0.9 correlation coefficients). Using iBRIDGE, we identified markers of inflamed phenotypes in malignant cells, myeloid cells, and fibroblasts, establishing type I and type II interferon pathways as dominant signals, especially in malignant and myeloid cells, and finding the TGFβ-driven mesenchymal phenotype not only in fibroblasts but also in malignant cells.
Besides relative classification, per-patient average iBRIDGE scores and independent RNAScope quantifications were utilized for threshold-based absolute classification. Moreover, iBRIDGE can be applied to in vitro grown cancer cell lines and can identify the cell lines that are adapted from inflamed/cold patient tumors.
BioTuring
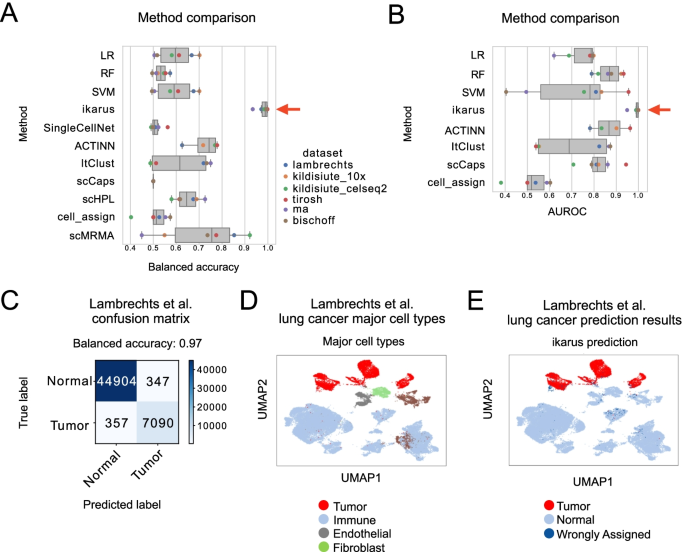
Tumors are complex tissues of cancerous cells surrounded by a heterogeneous cellular microenvironment with which they interact. Single-cell sequencing enables molecular characterization of single cells within the tumor. However, cell annotation—the assignment of cell type or cell state to each sequenced cell—is a challenge, especially identifying tumor cells within single-cell or spatial sequencing experiments.
Here, we propose ikarus, a machine learning pipeline aimed at distinguishing tumor cells from normal cells at the single-cell level. We test ikarus on multiple single-cell datasets, showing that it achieves high sensitivity and specificity in multiple experimental contexts.
**InferCNV** is a Bayesian method, which agglomerates the expression signal of genomically adjointed genes to ascertain whether there is a gain or loss of a certain larger genomic segment. We have used **inferCNV** to call copy number variations in all samples used in the manuscript.

BioTuring
The development of large-scale single-cell atlases has allowed describing cell states in a more detailed manner. Meanwhile, current deep leanring methods enable rapid analysis of newly generated query datasets by mapping them into reference atlases.
expiMap (‘explainable programmable mapper’) Lotfollahi, Mohammad, et al. is one of the methods proposed for single-cell reference mapping. Furthermore, it incorporates prior knowledge from gene sets databases or users to analyze query data in the context of known gene programs (GPs).

BioTuring
Single-cell RNA sequencing methods can profile the transcriptomes of single cells but cannot preserve spatial information. Conversely, spatial transcriptomics assays can profile spatial regions in tissue sections but do not have single-cell resolution.
Here, Runmin Wei (Siyuan He, Shanshan Bai, Emi Sei, Min Hu, Alastair Thompson, Ken Chen, Savitri Krishnamurthy & Nicholas E. Navin) developed a computational method called CellTrek that combines these two datasets to achieve single-cell spatial mapping through coembedding and metric learning approaches. They benchmarked CellTrek using simulation and in situ hybridization datasets, which demonstrated its accuracy and robustness.
They then applied CellTrek to existing mouse brain and kidney datasets and showed that CellTrek can detect topological patterns of different cell types and cell states. They performed single-cell RNA sequencing and spatial transcriptomics experiments on two ductal carcinoma in situ tissues and applied CellTrek to identify tumor subclones that were restricted to different ducts, and specific T-cell states adjacent to the tumor areas.
Trends

BioTuring
Single-cell RNA sequencing (scRNA-seq) protocols often face challenges in measuring the expression of all genes within a cell due to various factors, such as technical noise, the sensitivity of scRNA-seq techniques, or sample quality. This limitation(More)
| Notebooks |
|---|