


Notebooks

Categories


Cells
Premium

BioTuring
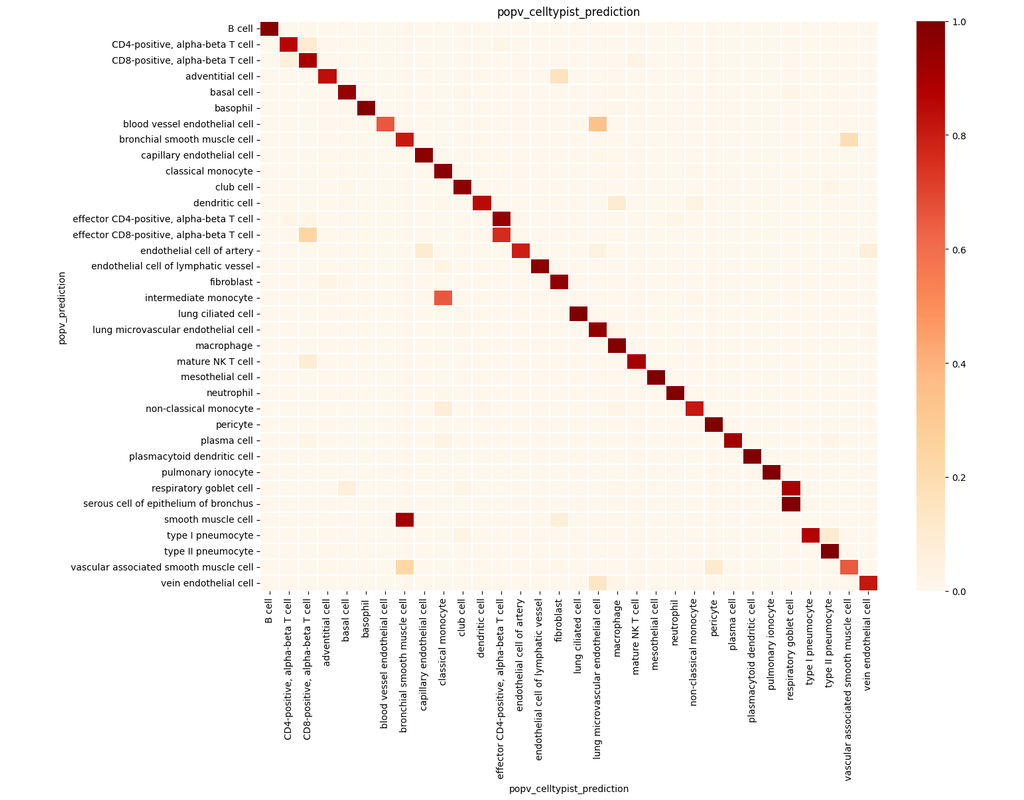
PopV uses popular vote of a variety of cell-type transfer tools to classify cell-types in a query dataset based on a test dataset.
Using this variety of algorithms, they compute the agreement between those algorithms and use this agreement to predict which cell-types have a high likelihood of the same cell-types observed in the reference.
BioTuring
In the realm of transcriptional dynamics, understanding the intricate interplay of regulatory proteins is crucial for deciphering processes ranging from normal development to disease progression. However, traditional RNA velocity methods often overlook the underlying regulatory drivers of gene expression changes over time. This gap in knowledge hinders our ability to unravel the mechanistic intricacies of these dynamic processes.
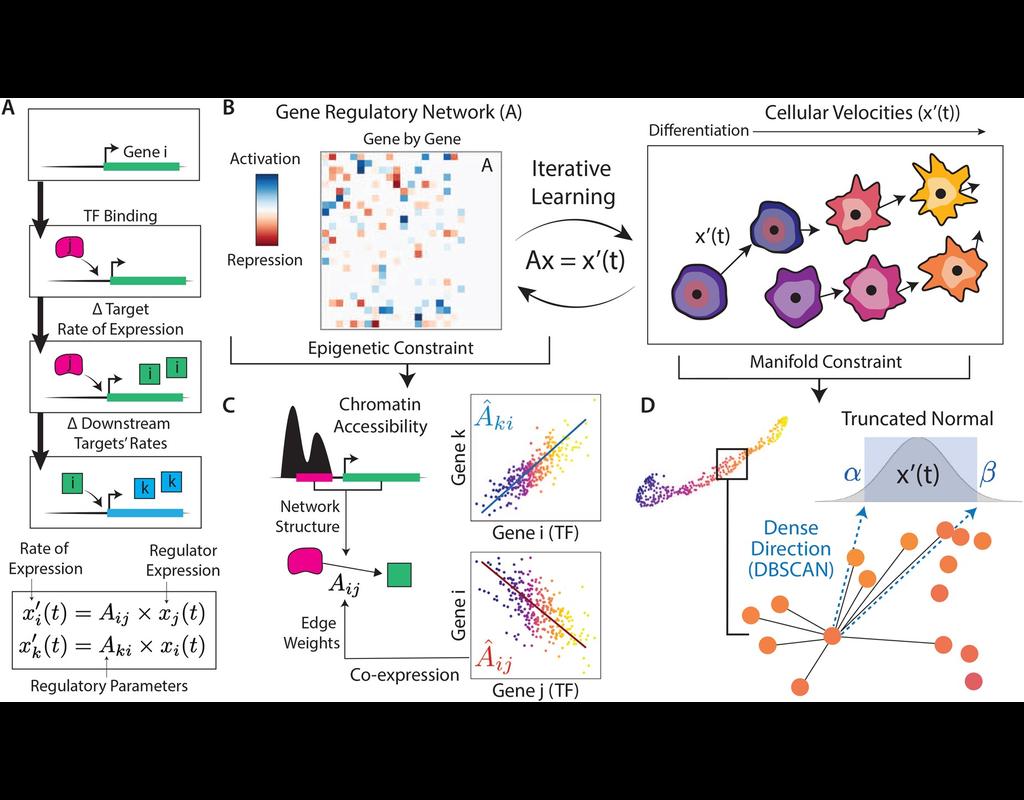
scKINETICs (Key regulatory Interaction NETwork for Inferring Cell Speed) (Burdziak et al, 2023) offers a dynamic model for gene expression changes that simultaneously learns per-cell transcriptional velocities and a governing gene regulatory network. By employing an expectation-maximization approach, scKINETICS quantifies the impact of each regulatory element on its target genes, incorporating insights from epigenetic data, gene-gene coexpression patterns and constraints dictated by the phenotypic manifold.

BioTuring
Build single-cell trajectories with the software that introduced **pseudotime**. Find out about cell fate decisions and the genes regulated as they're made.
Group and classify your cells based on gene expression. Identify new cell types and states and the genes that distinguish them.
Find genes that vary between cell types and states, over trajectories, or in response to perturbations using statistically robust, flexible differential analysis.
In development, disease, and throughout life, cells transition from one state to another. Monocle introduced the concept of **pseudotime**, which is a measure of how far a cell has moved through biological progress.
Many researchers are using single-cell RNA-Seq to discover new cell types. Monocle 3 can help you purify them or characterize them further by identifying key marker genes that you can use in follow-up experiments such as immunofluorescence or flow sorting.
**Single-cell trajectory analysis** shows how cells choose between one of several possible end states. The new reconstruction algorithms introduced in Monocle 3 can robustly reveal branching trajectories, along with the genes that cells use to navigate these decisions.

BioTuring
Spatially resolved gene expression profiles are key to understand tissue organization and function. However, spatial transcriptomics (ST) profiling techniques lack single-cell resolution and require a combination with single-cell RNA sequencing (scRNA-seq) information to deconvolute the spatially indexed datasets.
Leveraging the strengths of both data types, we developed SPOTlight, a computational tool that enables the integration of ST with scRNA-seq data to infer the location of cell types and states within a complex tissue. SPOTlight is centered around a seeded non-negative matrix factorization (NMF) regression, initialized using cell-type marker genes and non-negative least squares (NNLS) to subsequently deconvolute ST capture locations (spots).
Simulating varying reference quantities and qualities, we confirmed high prediction accuracy also with shallowly sequenced or small-sized scRNA-seq reference datasets. SPOTlight deconvolution of the mouse brain correctly mapped subtle neuronal cell states of the cortical layers and the defined architecture of the hippocampus. In human pancreatic cancer, we successfully segmented patient sections and further fine-mapped normal and neoplastic cell states.
Trained on an external single-cell pancreatic tumor references, we further charted the localization of clinical-relevant and tumor-specific immune cell states, an illustrative example of its flexible application spectrum and future potential in digital pathology.
Trends

BioTuring
Computational methods that model how the gene expression of a cell is influenced by interacting cells are lacking.
We present NicheNet, a method that predicts ligand–target links between interacting cells by combining their expression data with(More)