


Notebooks

Categories


Cells
Premium

BioTuring
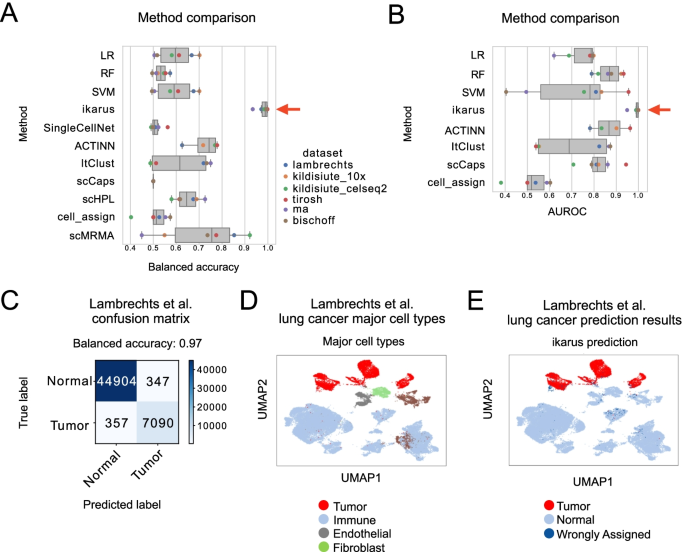
Tumors are complex tissues of cancerous cells surrounded by a heterogeneous cellular microenvironment with which they interact. Single-cell sequencing enables molecular characterization of single cells within the tumor. However, cell annotation—the assignment of cell type or cell state to each sequenced cell—is a challenge, especially identifying tumor cells within single-cell or spatial sequencing experiments.
Here, we propose ikarus, a machine learning pipeline aimed at distinguishing tumor cells from normal cells at the single-cell level. We test ikarus on multiple single-cell datasets, showing that it achieves high sensitivity and specificity in multiple experimental contexts.
**InferCNV** is a Bayesian method, which agglomerates the expression signal of genomically adjointed genes to ascertain whether there is a gain or loss of a certain larger genomic segment. We have used **inferCNV** to call copy number variations in all samples used in the manuscript.

BioTuring
Single-cell RNA sequencing (scRNA-seq) data have allowed us to investigate cellular heterogeneity and the kinetics of a biological process. Some studies need to understand how cells change state, and corresponding genes during the process, but it is challenging to track the cell development in scRNA-seq protocols. Therefore, a variety of statistical and computational methods have been proposed for lineage inference (or pseudotemporal ordering) to reconstruct the states of cells according to the developmental process from the measured snapshot data. Specifically, lineage refers to an ordered transition of cellular states, where individual cells represent points along. pseudotime is a one-dimensional variable representing each cell’s transcriptional progression toward the terminal state.
Slingshot which is one of the methods suggested for lineage reconstruction and pseudotime inference from single-cell gene expression data. In this notebook, we will illustrate an example workflow for cell lineage and pseudotime inference using Slingshot. The notebook is inspired by Slingshot's vignette and modified to demonstrate how the tool works on BioTuring's platform.

BioTuring
Computational methods that model how the gene expression of a cell is influenced by interacting cells are lacking.
We present NicheNet, a method that predicts ligand–target links between interacting cells by combining their expression data with prior knowledge of signaling and gene regulatory networks.
We applied NicheNet to the tumor and immune cell microenvironment data and demonstrated that NicheNet can infer active ligands and their gene regulatory effects on interacting cells.
BioTuring
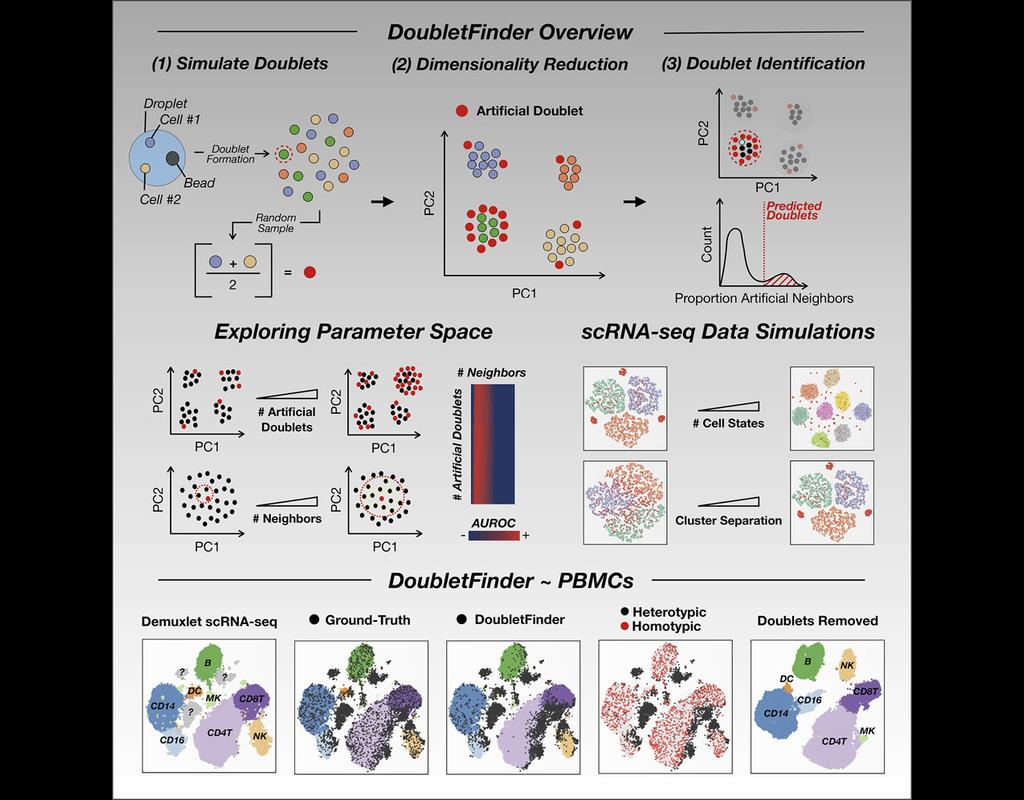
Single-cell RNA sequencing (scRNA-seq) data often encountered technical artifacts called "doublets" which are two cells that are sequenced under the same cellular barcode.
Doublets formed from different cell types or states are called heterotypic and homotypic otherwise. These factors constrain cell throughput and may result in misleading biological interpretations.
DoubletFinder (McGinnis, Murrow, and Gartner 2019) is one of the methods proposed for doublet detection. In this notebook, we will illustrate an example workflow of DoubletFinder. We use a 10x Genomics dataset which captures peripheral blood mononuclear cells (PBMCs) from a healthy donor stained with a panel of 31 TotalSeq™-B antibodies (BioLegend).
Trends

BioTuring
Advances in multi-omics have led to an explosion of multimodal datasets to address questions from basic biology to translation. While these data provide novel opportunities for discovery, they also pose management and analysis challenges, thus motiva(More)