


Notebooks

Categories


Cells
Premium


BioTuring
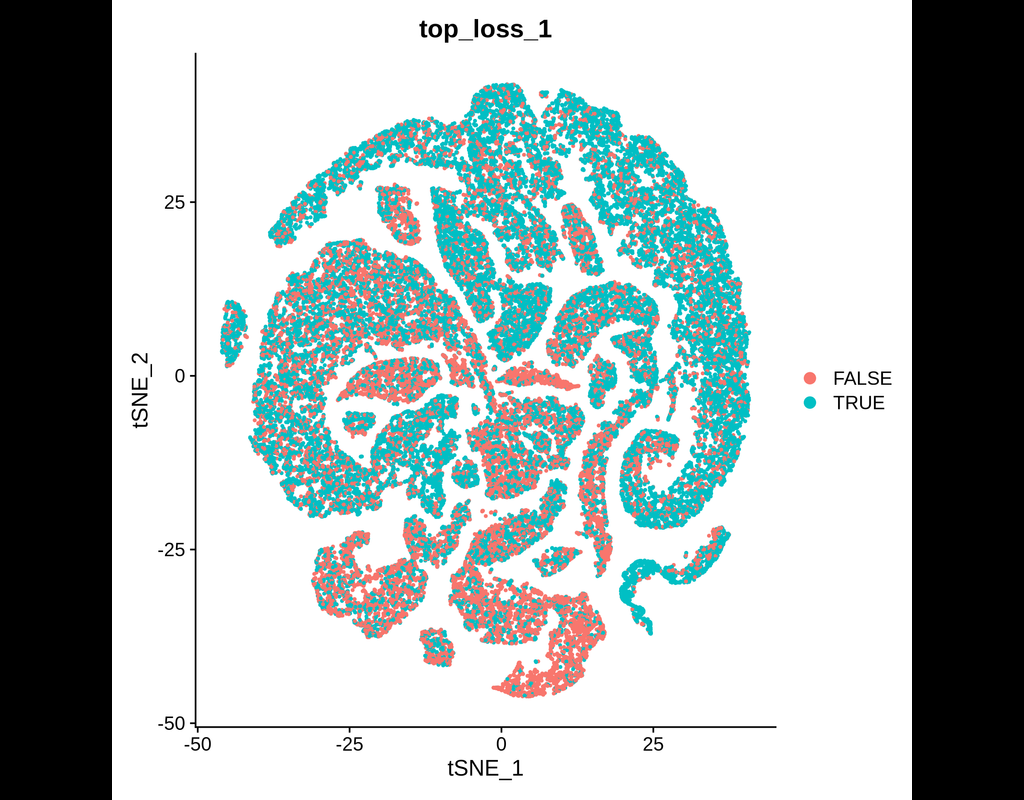
Expanded CRISPR-compatible CITE-seq (ECCITE-seq) which is built upon pooled CRISPR screens, allows to simultaneously measure transcriptomes, surface protein levels, and single-guide RNA (sgRNA) sequences at single-cell resolution. The technique enables multimodal characterization of each perturbation and effect exploration. However, it also encounters heterogeneity and complexity which can cause substantial noise into downstream analyses.
Mixscape (Papalexi, Efthymia, et al., 2021) is a computational framework proposed to substantially improve the signal-to-noise ratio in single-cell perturbation screens by identifying and removing confounding sources of variation.
In this notebooks, we demonstrate Mixscape's features using pertpy - a Python package offering a range of tools for perturbation analysis. The original pipeline of Mixscape implemented in R can be found here.
BioTuring
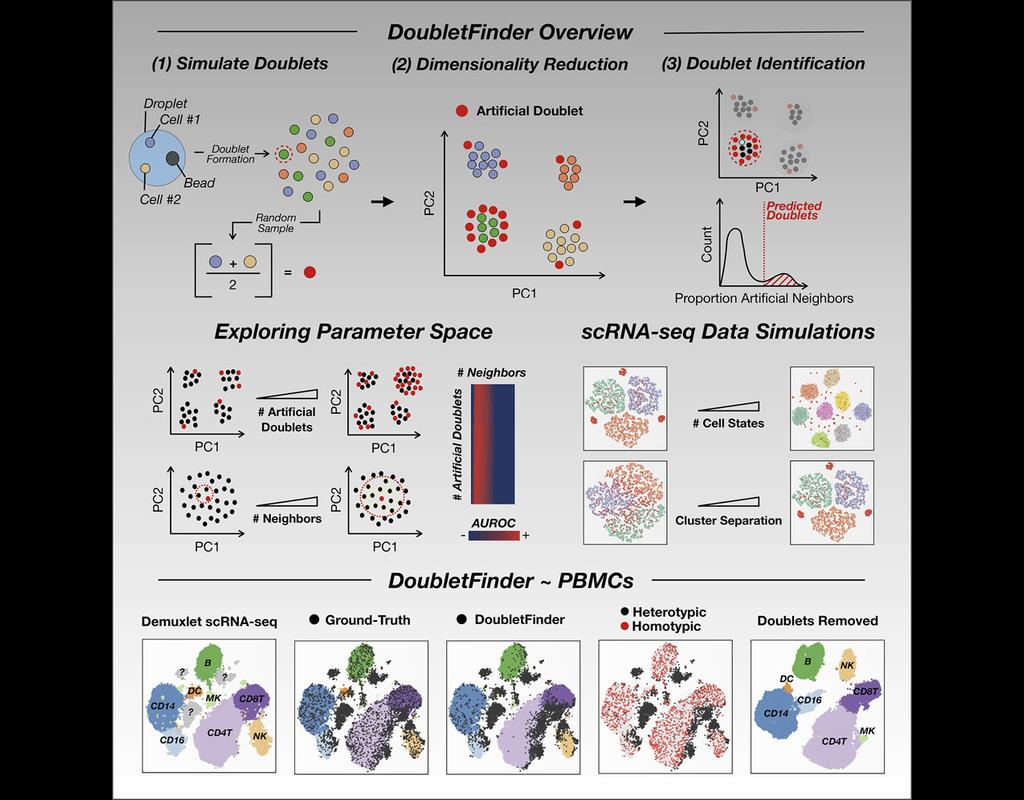
Single-cell RNA sequencing (scRNA-seq) data often encountered technical artifacts called "doublets" which are two cells that are sequenced under the same cellular barcode.
Doublets formed from different cell types or states are called heterotypic and homotypic otherwise. These factors constrain cell throughput and may result in misleading biological interpretations.
DoubletFinder (McGinnis, Murrow, and Gartner 2019) is one of the methods proposed for doublet detection. In this notebook, we will illustrate an example workflow of DoubletFinder. We use a 10x Genomics dataset which captures peripheral blood mononuclear cells (PBMCs) from a healthy donor stained with a panel of 31 TotalSeq™-B antibodies (BioLegend).
BioTuring
scVI-tools (single-cell variational inference tools) is a package for end-to-end analysis of single-cell omics data primarily developed and maintained by the Yosef Lab at UC Berkeley. scvi-tools has two components
- Interface for easy use of a range of probabilistic models for single-cell omics (e.g., scVI, scANVI, totalVI).
- Tools to build new probabilistic models, which are powered by PyTorch, PyTorch Lightning, and Pyro.
BioTuring
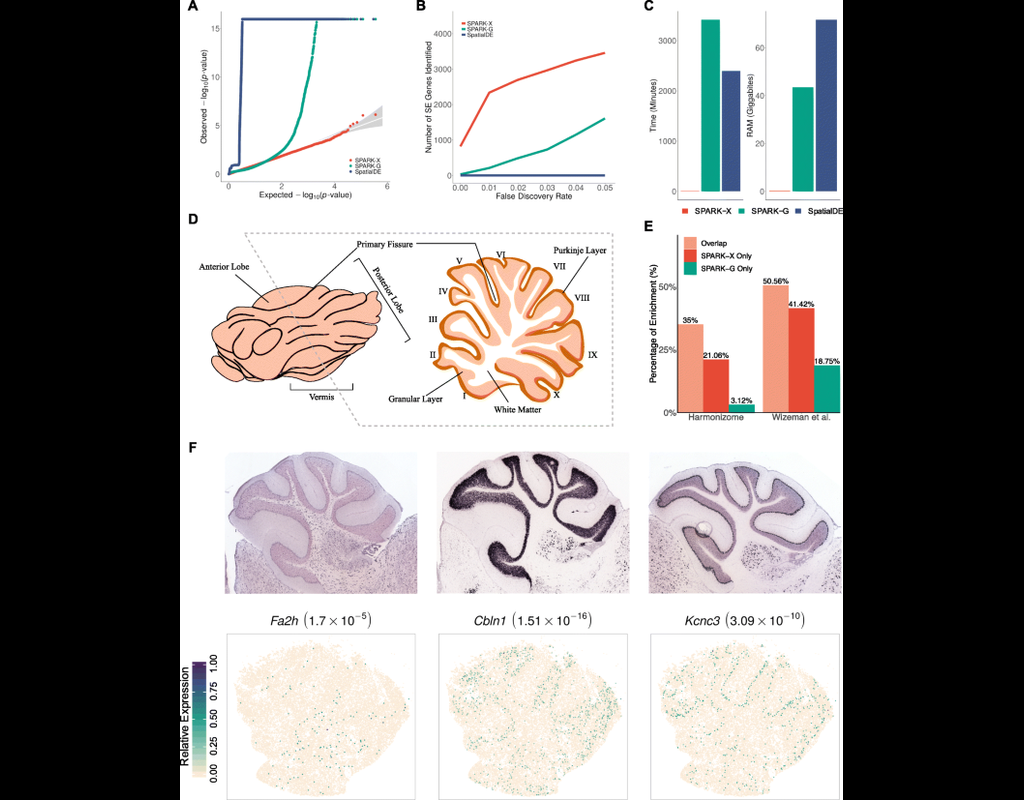
Spatial transcriptomic studies are becoming increasingly common and large, posing important statistical and computational challenges for many analytic tasks. Here, we present SPARK-X, a non-parametric method for rapid and effective detection of spatially expressed genes in large spatial transcriptomic studies.
SPARK-X not only produces effective type I error control and high power but also brings orders of magnitude computational savings. We apply SPARK-X to analyze three large datasets, one of which is only analyzable by SPARK-X. In these data, SPARK-X identifies many spatially expressed genes including those that are spatially expressed within the same cell type, revealing new biological insights.
Trends
BioTuring
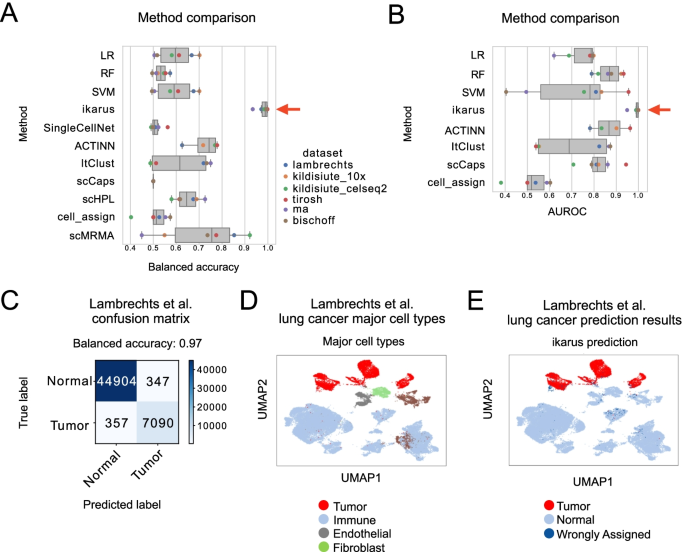
Tumors are complex tissues of cancerous cells surrounded by a heterogeneous cellular microenvironment with which they interact. Single-cell sequencing enables molecular characterization of single cells within the tumor. However, cell annotation—the(More)
BioTuring
This tool provides a user-friendly and automated way to analyze large-scale single-cell RNA-seq datasets stored in RDS (Seurat) format. It allows users to run various analysis tools on their data in one command, streamlining the analysis workflow and(More)