


Notebooks

Categories


Cells
Premium

BioTuring
Classification of tumor and normal cells in the tumor microenvironment from scRNA-seq data is an ongoing challenge in human cancer study.
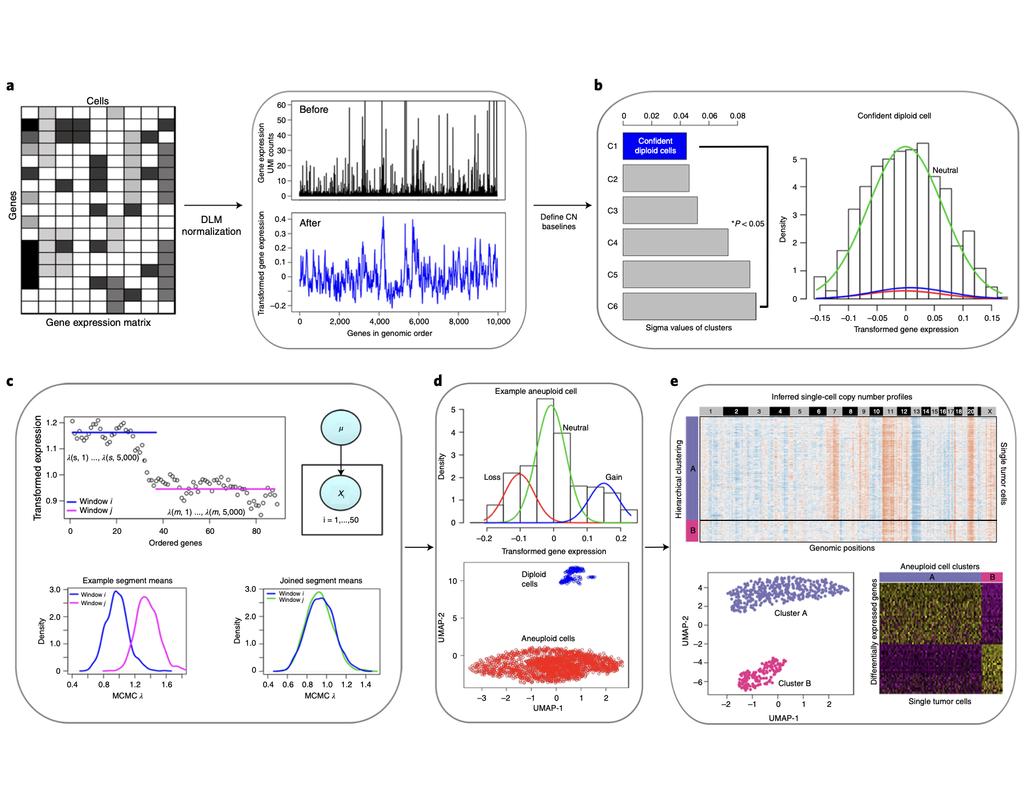
Copy number karyotyping of aneuploid tumors (***copyKAT***) (Gao, Ruli, et al., 2021) is a method proposed for identifying copy number variations in single-cell transcriptomics data. It is used to predict aneuploid tumor cells and delineate the clonal substructure of different subpopulations that coexist within the tumor mass.
In this notebook, we will illustrate a basic workflow of CopyKAT based on the tutorial provided on CopyKAT's repository. We will use a dataset of triple negative cancer tumors sequenced by 10X Chromium 3'-scRNAseq (GSM4476486) as an example. The dataset contains 20,990 features across 1,097 cells. We have modified the notebook to demonstrate how the tool works on BioTuring's platform.

BioTuring
The development of immune checkpoint-based immunotherapies has been a major advancement in the treatment of cancer, with a subset of patients exhibiting durable clinical responses. A predictive biomarker for immunotherapy response is the pre-existing T-cell infiltration in the tumor immune microenvironment (TIME).
Bulk transcriptomics-based approaches can quantify the degree of T-cell infiltration using deconvolution methods and identify additional markers of inflamed/cold cancers at the bulk level. However, bulk techniques are unable to identify biomarkers of individual cell types. Although single-cell RNA sequencing (scRNAseq) assays are now being used to profile the TIME, to our knowledge there is no method of identifying patients with a T-cell inflamed TIME from scRNAseq data. Here, we describe a method, iBRIDGE, which integrates reference bulk RNAseq data with the malignant subset of scRNAseq datasets to identify patients with a T-cell inflamed TIME.
Utilizing two datasets with matched bulk data, we show iBRIDGE results correlated highly with bulk assessments (0.85 and 0.9 correlation coefficients). Using iBRIDGE, we identified markers of inflamed phenotypes in malignant cells, myeloid cells, and fibroblasts, establishing type I and type II interferon pathways as dominant signals, especially in malignant and myeloid cells, and finding the TGFβ-driven mesenchymal phenotype not only in fibroblasts but also in malignant cells.
Besides relative classification, per-patient average iBRIDGE scores and independent RNAScope quantifications were utilized for threshold-based absolute classification. Moreover, iBRIDGE can be applied to in vitro grown cancer cell lines and can identify the cell lines that are adapted from inflamed/cold patient tumors.

BioTuring
Cell–cell communication mediated by ligand–receptor complexes is critical to coordinating diverse biological processes, such as development, differentiation and inflammation.
To investigate how the context-dependent crosstalk of different cell types enables physiological processes to proceed, we developed CellPhoneDB, a novel repository of ligands, receptors and their interactions. In contrast to other repositories, our database takes into account the subunit architecture of both ligands and receptors, representing heteromeric complexes accurately.
We integrated our resource with a statistical framework that predicts enriched cellular interactions between two cell types from single-cell transcriptomics data. Here, we outline the structure and content of our repository, provide procedures for inferring cell–cell communication networks from single-cell RNA sequencing data and present a practical step-by-step guide to help implement the protocol.
CellPhoneDB v.2.0 is an updated version of our resource that incorporates additional functionalities to enable users to introduce new interacting molecules and reduces the time and resources needed to interrogate large datasets.
CellPhoneDB v.2.0 is publicly available, both as code and as a user-friendly web interface; it can be used by both experts and researchers with little experience in computational genomics.
In our protocol, we demonstrate how to evaluate meaningful biological interactions with CellPhoneDB v.2.0 using published datasets. This protocol typically takes ~2 h to complete, from installation to statistical analysis and visualization, for a dataset of ~10 GB, 10,000 cells and 19 cell types, and using five threads.
BioTuring
Cell2location is a principled Bayesian model that can resolve fine-grained cell types in spatial transcriptomic data and create comprehensive cellular maps of diverse tissues. Cell2location accounts for technical sources of variation and borrows statistical strength across locations, thereby enabling the integration of single cell and spatial transcriptomics with higher sensitivity and resolution than existing tools. This is achieved by estimating which combination of cell types in which cell abundance could have given the mRNA counts in the spatial data, while modelling technical effects (platform/technology effect, contaminating RNA, unexplained variance).
This tutorial shows how to use cell2location method for spatially resolving fine-grained cell types by integrating 10X Visium data with scRNA-seq reference of cell types. Cell2location is a principled Bayesian model that estimates which combination of cell types in which cell abundance could have given the mRNA counts in the spatial data, while modelling technical effects (platform/technology effect, contaminating RNA, unexplained variance).
Trends
BioTuring
The development of immune checkpoint-based immunotherapies has been a major advancement in the treatment of cancer, with a subset of patients exhibiting durable clinical responses. A predictive biomarker for immunotherapy response is the pre-existing(More)