


Notebooks

Categories


Cells
Premium

BioTuring
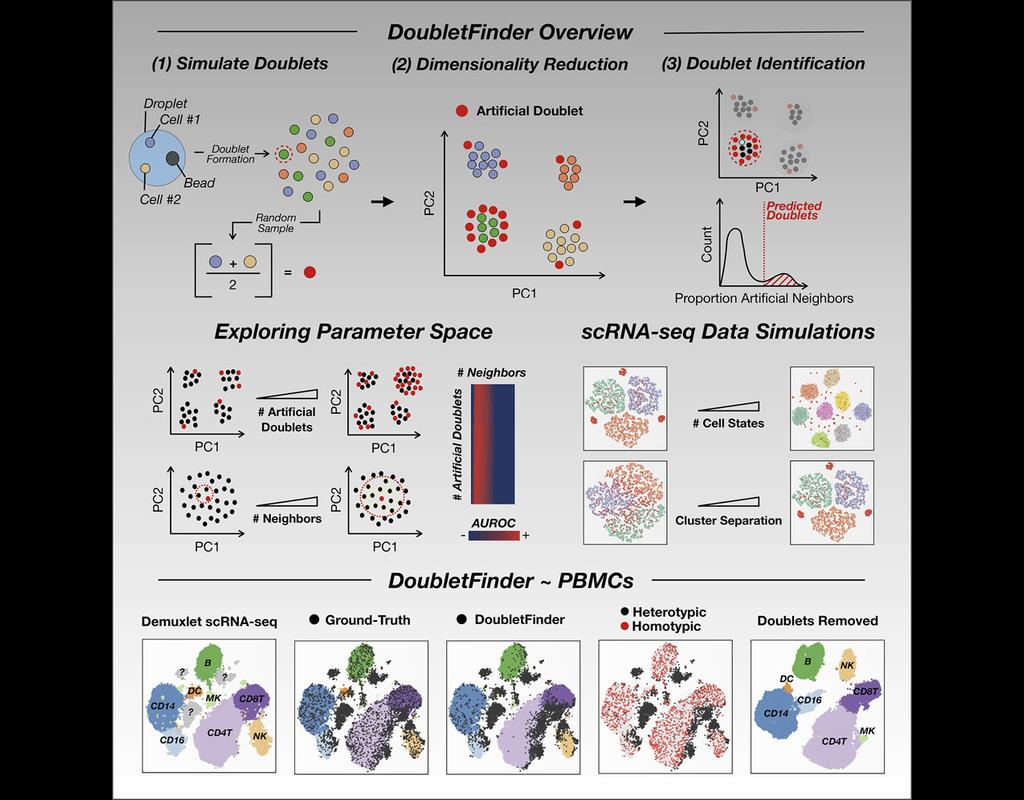
Single-cell RNA sequencing (scRNA-seq) data often encountered technical artifacts called "doublets" which are two cells that are sequenced under the same cellular barcode.
Doublets formed from different cell types or states are called heterotypic and homotypic otherwise. These factors constrain cell throughput and may result in misleading biological interpretations.
DoubletFinder (McGinnis, Murrow, and Gartner 2019) is one of the methods proposed for doublet detection. In this notebook, we will illustrate an example workflow of DoubletFinder. We use a 10x Genomics dataset which captures peripheral blood mononuclear cells (PBMCs) from a healthy donor stained with a panel of 31 TotalSeq™-B antibodies (BioLegend).
BioTuring
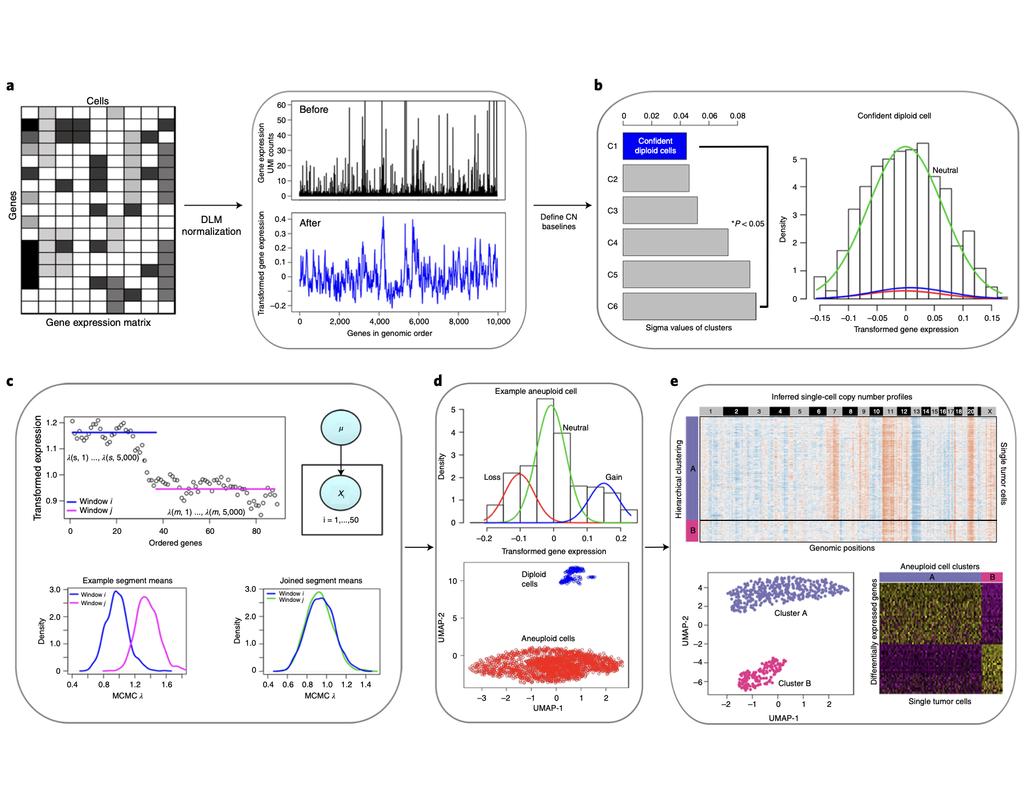
Classification of tumor and normal cells in the tumor microenvironment from scRNA-seq data is an ongoing challenge in human cancer study.
Copy number karyotyping of aneuploid tumors (***copyKAT***) (Gao, Ruli, et al., 2021) is a method proposed for identifying copy number variations in single-cell transcriptomics data. It is used to predict aneuploid tumor cells and delineate the clonal substructure of different subpopulations that coexist within the tumor mass.
In this notebook, we will illustrate a basic workflow of CopyKAT based on the tutorial provided on CopyKAT's repository. We will use a dataset of triple negative cancer tumors sequenced by 10X Chromium 3'-scRNAseq (GSM4476486) as an example. The dataset contains 20,990 features across 1,097 cells. We have modified the notebook to demonstrate how the tool works on BioTuring's platform.
BioTuring
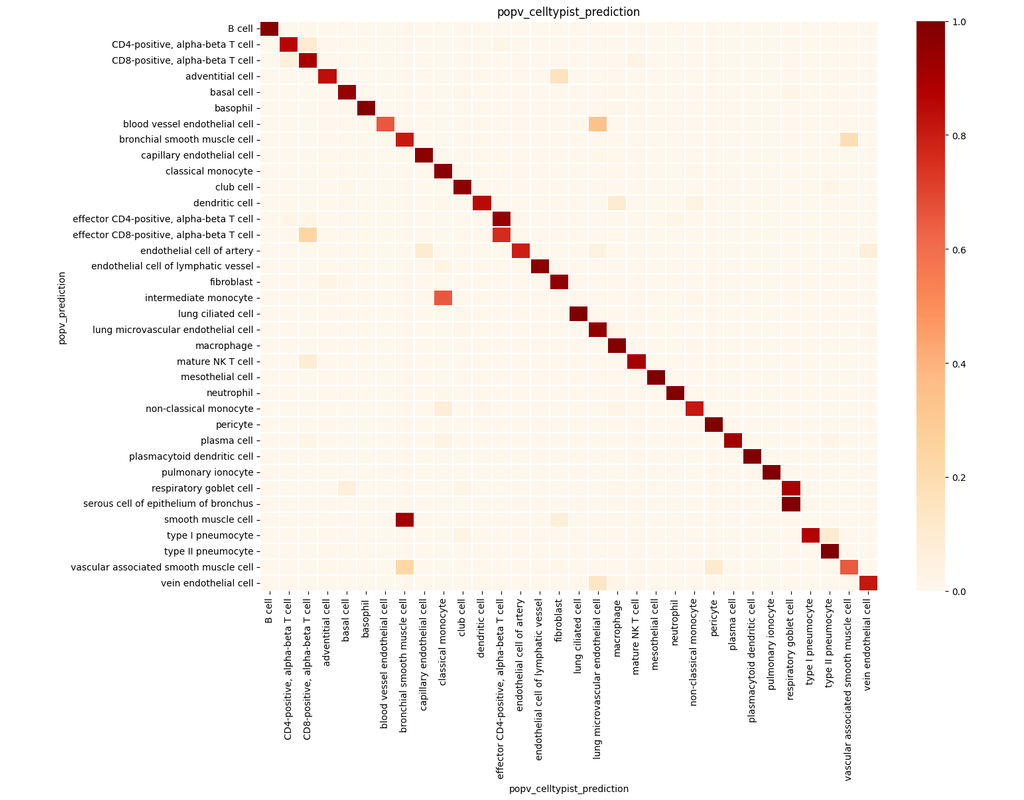
PopV uses popular vote of a variety of cell-type transfer tools to classify cell-types in a query dataset based on a test dataset.
Using this variety of algorithms, they compute the agreement between those algorithms and use this agreement to predict which cell-types have a high likelihood of the same cell-types observed in the reference.

BioTuring
Single-cell RNA sequencing methods can profile the transcriptomes of single cells but cannot preserve spatial information. Conversely, spatial transcriptomics assays can profile spatial regions in tissue sections but do not have single-cell resolution.
Here, Runmin Wei (Siyuan He, Shanshan Bai, Emi Sei, Min Hu, Alastair Thompson, Ken Chen, Savitri Krishnamurthy & Nicholas E. Navin) developed a computational method called CellTrek that combines these two datasets to achieve single-cell spatial mapping through coembedding and metric learning approaches. They benchmarked CellTrek using simulation and in situ hybridization datasets, which demonstrated its accuracy and robustness.
They then applied CellTrek to existing mouse brain and kidney datasets and showed that CellTrek can detect topological patterns of different cell types and cell states. They performed single-cell RNA sequencing and spatial transcriptomics experiments on two ductal carcinoma in situ tissues and applied CellTrek to identify tumor subclones that were restricted to different ducts, and specific T-cell states adjacent to the tumor areas.
Trends

BioTuring
Single-cell RNA-seq datasets in diverse biological and clinical conditions provide great opportunities for the full transcriptional characterization of cell types.
However, the integration of these datasets is challeging as they remain biological(More)