


Notebooks

Categories


Cells
Notebook
Premium

BioTuring
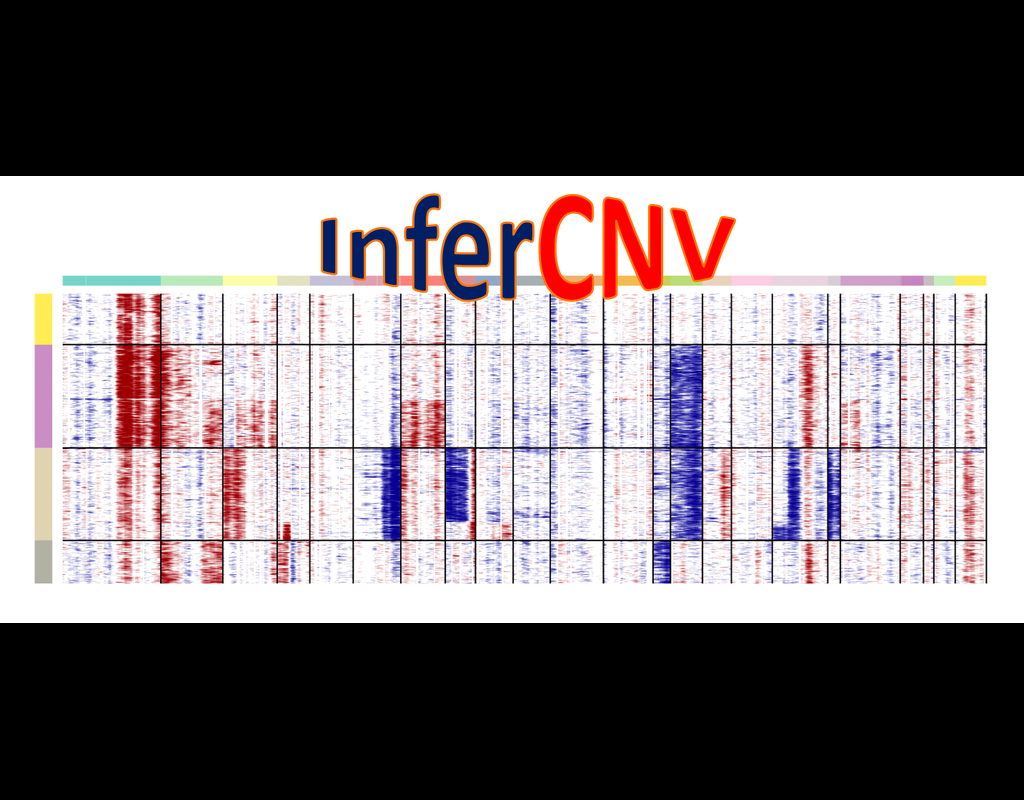
InferCNV is used to explore tumor single cell RNA-Seq data to identify evidence for somatic large-scale chromosomal copy number alterations, such as gains or deletions of entire chromosomes or large segments of chromosomes. This is done by exploring expression intensity of genes across positions of tumor genome in comparison to a set of reference 'normal' cells. A heatmap is generated illustrating the relative expression intensities across each chromosome, and it often becomes readily apparent as to which regions of the tumor genome are over-abundant or less-abundant as compared to that of normal cells.
**Infercnvpy** is a scalable python library to infer copy number variation (CNV) events from single cell transcriptomics data. It is heavliy inspired by InferCNV, but plays nicely with scanpy and is much more scalable.

BioTuring
The development of large-scale single-cell atlases has allowed describing cell states in a more detailed manner. Meanwhile, current deep leanring methods enable rapid analysis of newly generated query datasets by mapping them into reference atlases.
expiMap (‘explainable programmable mapper’) Lotfollahi, Mohammad, et al. is one of the methods proposed for single-cell reference mapping. Furthermore, it incorporates prior knowledge from gene sets databases or users to analyze query data in the context of known gene programs (GPs).

BioTuring
CellRank2 (Weiler et al, 2023) is a powerful framework for studying cellular fate using single-cell RNA sequencing data. It can handle millions of cells and different data types efficiently. This tool can identify cell fate and probabilities across various data sets. It also allows for analyzing transitions over time and uncovering key genes in developmental processes. Additionally, CellRank2 estimates cell-specific transcription and degradation rates, aiding in understanding differentiation trajectories and regulatory mechanisms.
In this notebook, we will use a primary tumor sample of patient T71 from the dataset GSE137804 (Dong R. et al, 2020) as an example. We have performed RNA-velocity analysis and pseudotime calculation on this dataset in scVelo (Bergen et al, 2020) notebook. The output will be then loaded into this CellRank2 notebook for further analysis.
This notebook is based on the tutorial provided on CellRank2 documentation. We have modified the notebook and changed the input data to show how the tool works on BioTuring's platform.

BioTuring
Understanding global communications among cells requires accurate representation of cell-cell signaling links and effective systems-level analyses of those links.
We construct a database of interactions among ligands, receptors and their cofactors that accurately represent known heteromeric molecular complexes. We then develop **CellChat**, a tool that is able to quantitatively infer and analyze intercellular communication networks from single-cell RNA-sequencing (scRNA-seq) data.
CellChat predicts major signaling inputs and outputs for cells and how those cells and signals coordinate for functions using network analysis and pattern recognition approaches. Through manifold learning and quantitative contrasts, CellChat classifies signaling pathways and delineates conserved and context-specific pathways across different datasets.
Applying **CellChat** to mouse and human skin datasets shows its ability to extract complex signaling patterns.