


Notebooks

Categories


Cells
Premium

BioTuring
Cell2location is a principled Bayesian model that can resolve fine-grained cell types in spatial transcriptomic data and create comprehensive cellular maps of diverse tissues. Cell2location accounts for technical sources of variation and borrows statistical strength across locations, thereby enabling the integration of single cell and spatial transcriptomics with higher sensitivity and resolution than existing tools. This is achieved by estimating which combination of cell types in which cell abundance could have given the mRNA counts in the spatial data, while modelling technical effects (platform/technology effect, contaminating RNA, unexplained variance).
This tutorial shows how to use cell2location method for spatially resolving fine-grained cell types by integrating 10X Visium data with scRNA-seq reference of cell types. Cell2location is a principled Bayesian model that estimates which combination of cell types in which cell abundance could have given the mRNA counts in the spatial data, while modelling technical effects (platform/technology effect, contaminating RNA, unexplained variance).

BioTuring
Single-cell RNA sequencing (scRNA-seq) protocols often face challenges in measuring the expression of all genes within a cell due to various factors, such as technical noise, the sensitivity of scRNA-seq techniques, or sample quality. This limitation gives rise to a need for the prediction of unmeasured gene expression values (also known as dropout imputation) from scRNA-seq data.
ADImpute (Leote A, 2023) is an R package combining several dropout imputation methods, including two existing methods (DrImpute, SAVER), two novel implementations: Network, a gene regulatory network-based approach using gene-gene relationships learned from external data, and Baseline, a method corresponding to a sample-wide average..
This notebook is to illustrate an example workflow of ADImpute on sample datasets loaded from the package. The notebook content is inspired from ADImpute's vignette and modified to demonstrate how the tool works on BioTuring's platform.

BioTuring
Single-cell RNA sequencing methods can profile the transcriptomes of single cells but cannot preserve spatial information. Conversely, spatial transcriptomics assays can profile spatial regions in tissue sections but do not have single-cell resolution.
Here, Runmin Wei (Siyuan He, Shanshan Bai, Emi Sei, Min Hu, Alastair Thompson, Ken Chen, Savitri Krishnamurthy & Nicholas E. Navin) developed a computational method called CellTrek that combines these two datasets to achieve single-cell spatial mapping through coembedding and metric learning approaches. They benchmarked CellTrek using simulation and in situ hybridization datasets, which demonstrated its accuracy and robustness.
They then applied CellTrek to existing mouse brain and kidney datasets and showed that CellTrek can detect topological patterns of different cell types and cell states. They performed single-cell RNA sequencing and spatial transcriptomics experiments on two ductal carcinoma in situ tissues and applied CellTrek to identify tumor subclones that were restricted to different ducts, and specific T-cell states adjacent to the tumor areas.
BioTuring
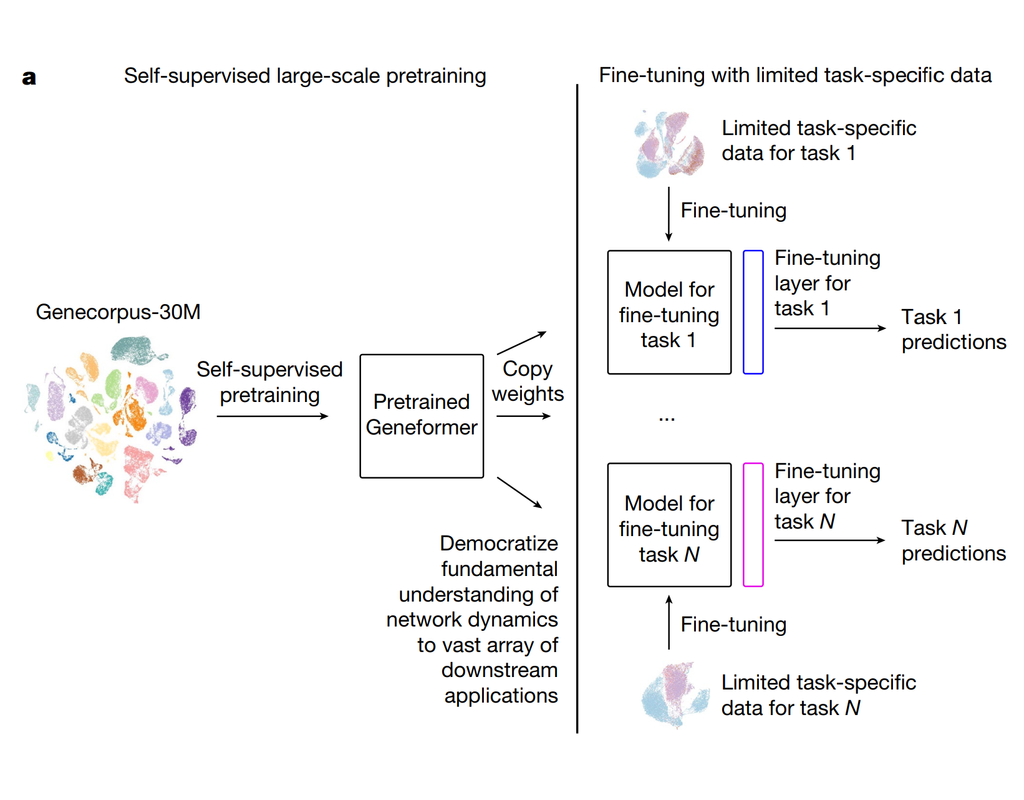
Geneformer is a foundation transformer model pretrained on a large-scale corpus of ~30 million single cell transcriptomes to enable context-aware predictions in settings with limited data in network biology. Here, we will demonstrate a basic workflow to work with ***Geneformer*** models.
These notebooks include the instruction to:
1. Prepare input datasets
2. Finetune Geneformer model to perform specific task
3. Using finetuning models for cell classification and gene classification application
Trends
BioTuring
The recent development of single-cell RNA-sequencing (scRNA-seq) technology has enabled us to infer cell-type-specific co-expression networks, enhancing our understanding of cell-type-specific biological functions. However, existing methods proposed (More)